Thurrock draft Local Plan · Policy SS18 · Regulation 19
Representation on Policy SS18.
Lower Langdon and Corringham Park Farm: why the policy is not legally compliant and not sound, on the Council’s own evidence.
Filed with Thurrock Council on 14 October 2026 by Dr Jackie Lighten on behalf of Protect Langdon. The full representation follows below in two volumes. Volume 1 is the representation: a one-page summary, the requests, a longer summary, the fifteen findings, and then the grounds in full, sections 1 to 9. Volume 2 is the supporting schedules and analyses, Appendices A to Q.
Thurrock Local Plan Regulation 19, Lower Langdon and Corringham Park Farm.
Authored and submitted by Dr Jackie Lighten on behalf of Protect Langdon.
Form, question 3: "To which part of Local Plan does this representation relate" (policy, policy or site reference and name, paragraph, settlement; support, object or comment).
Policy SS18, New settlement north of the A13 (Lower Langdon and Corringham Park Farm), plan pages 288 to 296. With the related entries in Table 1 (Settlement Hierarchy), paragraph 4.2.3, Table 2 (Housing Requirement and Provision to 2044), Policy SP04, Policy DMP11 criterion 4, Appendix 2 (Local Plan Housing Trajectory) and the Policies Map [2]. Object.
Form, question 4: "Do you consider the Local Plan is: (1) legally compliant, (2) sound".
(1) Legally compliant: No.
The plan with Policy SS18 breaches two legal requirements, regulation 105 of the Conservation of Habitats and Species Regulations 2017 (ground L1, section 3.1) and regulation 12 of the Environmental Assessment of Plans and Programmes Regulations 2004 (ground L2, section 3.2), and leaves two statutory duties on the Council unaddressed, section 28G of the Wildlife and Countryside Act 1981 and section 40 of the Natural Environment and Rural Communities Act 2006 (section 3.4). Six findings are sought on them (section 3.6).
(2) Sound: No. The policy fails all four tests of soundness (sections 4 to 7).
Form, questions 5 and 6.
Question 5 asks for "details of why you consider the Local Plan is not legally compliant or is unsound", and question 6 for "the modification(s) you consider necessary to make the Local Plan legally compliant and sound" and why each will do so. They are not answered in a box. The answer to question 5 is sections 3 to 8 of this representation, with the summary as the short form. The answer to question 6 is section 2, modifications MM1 to MM9, with section 8 on why deletion is the right one.
Form, question 7: "If your representation is seeking a modification to the plan, do you consider it necessary to participate in examination hearing session(s)?"
Yes, I wish to participate in hearing sessions.
Question 8: "please outline why you consider this to be necessary": see section 9.
Notification. I ask to be notified at each stage: the submission of the plan for independent examination, the publication of the Inspector's matters, issues and questions and of the hearing dates, any consultation on main modifications or on an addendum to the Habitats Regulations Assessment or the sustainability appraisal, the publication of the Inspector's recommendations, and the adoption of the plan. (Town and Country Planning (Local Planning) (England) Regulations 2012, regulations 19 to 26.)
Further evidence.
The information requests listed in Appendix C fall due between 8 and 19 October 2026, and the Council's evidence base is still being examined. I will put what is received or found before the Inspector as the examination permits: in answer to the matters, issues and questions identified for examination, in any consultation on main modifications or on an addendum to the Habitats Regulations Assessment or the sustainability appraisal (section 3.6), and at the hearing sessions (section 9). Nothing in this representation depends on that later material. It is complete on the evidence published by the Council as at the date of filing.
Abbreviations
-
BRES: ONS Business Register and Employment Survey [110].
-
BS 8233: the British Standard for sound insulation and noise reduction for buildings.
-
EDM: Event Duration Monitoring, the Environment Agency's record of how often and how long each storm overflow spills [115].
-
EDNA: Economic Development Needs Assessment [42] (August 2025).
-
EUV: existing use value, the land's value in its current use, the base of the Council's viability land price test.
-
HEC-RAS: the US Army Corps of Engineers' River Analysis System, used here as a two-dimensional flood model.
-
HLAA: Housing Land Availability Assessment [38] (October 2025).
-
HNA: Housing Needs Assessment [41] (June 2025).
-
HRA: Habitats Regulations Assessment [11], the assessment the Conservation of Habitats and Species Regulations 2017 require of any plan likely to affect a protected European wildlife site.
-
IDP: Infrastructure Delivery Plan [30] (July 2026).
-
IIA: Integrated Impact Assessment [8], the plan's sustainability appraisal, which the law requires to test reasonable alternatives.
-
LAeq,16h, Lden, Lnight: average road noise levels in decibels over the day (07:00 to 23:00), over 24 hours with evening and night penalties, and over the night (23:00 to 07:00).
-
NPPF: National Planning Policy Framework. Unless stated, the December 2024 version, against which this plan is examined (NPPF August 2026 [75], Annex A paragraph 8).
-
RoFSW: the Environment Agency's Risk of Flooding from Surface Water map.
-
SANG: Suitable Alternative Natural Greenspace, land provided to draw visitors away from a protected site.
-
SPA: Special Protection Area.
-
SSSI: Site of Special Scientific Interest. Langdon Ridge SSSI adjoins the allocation.
-
SuDS: sustainable drainage systems, the ponds and basins that hold back a site's rainwater, sized here to the national SuDS standards (Defra, 2025).
-
SWMM: the US Environmental Protection Agency's Storm Water Management Model.
-
WCS: Water Cycle Study Scoping Report [43] (March 2024).
-
WHO: World Health Organization.
-
WRC: water recycling centre, a sewage treatment works.
-
WRMP: Water Resources Management Plan, the water company's statutory supply plan [116].
How to read this representation.
The main text is arranged by the tests the Inspector must apply, not by topic, because that is the order in which the plan will be examined: legal compliance (section 3), justified (section 4), effective (section 5), consistent with national policy (section 6) and positively prepared (section 7).
Each ground is numbered by the test it engages: L for legal compliance (section 3), J for justified (section 4) and E for effective (section 5). Sections 6 and 7 carry no codes.
A reader looking for a single topic (the SSSI and ecology, flooding and drainage, viability, infrastructure, access, housing need or the Green Belt) will find it under more than one test, because most of the plan's failures on this site fail more than one. Table S1, below the list of requests, gives, for each topic, the tests it fails and the sections where the evidence is.
The Quick Summary and the Extended Summary carry the conclusions. The sections carry the evidence, quoted and paged. The appendices carry the analyses, the correspondence and the record. The document is detailed so that nothing is left unexamined. Its length is proportionate to the thousands of pages the Council has published to support the Local Plan and Policy SS18, and to the scrutiny a proposal of this scale and impact deserves.
Volume 1: The Representation
This volume holds the summaries, the grounds (sections 1 to 9), the modifications sought and Appendices A, B, C, D and E. Volume 2 holds Appendix F (the schedule of defects) and Appendices G to Q (the independent analyses). In the filed copy the two volumes are separate documents. The length of this representation is proportionate to what it answers. The documents the Council has published to support this plan, held in the evidence repository offered to the Inspector and available on request, run to 57 documents and about 8,600 pages, among them a 1,255-page viability assessment, a 525-page sustainability appraisal with 530 pages of appendices, a 422-page plan and a 324-page Habitats Regulations Assessment. A representation that tests that evidence base, document by document and page by page, rather than asserting against it, cannot do so in fewer pages than these, and every page here is sourced to a page there.
Quick Summary
Who, and what is asked.
Protect Langdon, a residents' group, through Dr Jackie Lighten, whose property adjoins the allocation, objects to Policy SS18 of the Thurrock Local Plan 2024 to 2044: 5,000 homes on about 250 hectares of Green Belt north of the A13, at Lower Langdon (4,000) and Corringham Park Farm (1,000). It asks the Inspector to delete Policy SS18 and return both parcels to the Green Belt (section 2). It does not ask for the plan to be withdrawn: without SS18 the plan still provides 22,006 homes in the plan period against the Government's minimum of 21,480, and 23,179 to 24,096 with sites the Council's own housing land study found suitable but did not allocate (section 7.1).
The plan with SS18 is not legally compliant (section 3):
-
The Habitats Regulations Assessment (HRA) does not assess the allocation. "Langdon" does not appear in its 324 pages. The policy it calls "SS18" is West Horndon, numbered SS17 in the published plan, so the Lower Langdon allocation is not assessed under any number. Regulation 105 of the Habitats Regulations is not met.
-
Its water-quality conclusion relies on the wrong water company, Southern Water, which serves Kent. Thurrock's sewerage company is Anglian Water, which the HRA never names, and Anglian Water's Tilbury works, which would take the site's sewage, spilled 64 times in 2025.
-
The sustainability appraisal, the Integrated Impact Assessment (IIA), never appraised the strategy the plan adopts. The only option containing Lower Langdon lost to the option without it on eight objectives and won on none.
It is unsound on all four tests (sections 4 to 7):
-
Not justified. The Council's own Green Belt consultant wrote "Not recommended" and "Provisional Grey Belt: No". Its housing land study, the Housing Land Availability Assessment (HLAA), called the Corringham Park Farm parcel "Unsuitable". The capacity figure was written to a target. The land was offered by a promoter, not found by a search. No ecological survey, flood model or noise assessment exists. Nor does anyone else hold the data: Natural England confirms it has made no condition assessment of Langdon Ridge SSSI since the site was notified in 2018, and could find no information on birds, functionally linked land or bat roosts on the SS18 land (Appendix E5). No reason is given for overriding any of it. No exceptional circumstances are shown for this site.
-
Not effective. The Council's viability study values the land at minus £9.8 million. Nothing is delivered in the first five years. £256.6 million of infrastructure is funded by nobody, and many other infrastructure needs are not costed at all. National Highways will not take on the A13. On the Council's own policies we calculate that only 2,126 homes fit, with no affordable housing viable.
-
Not positively prepared. The homes are not needed to meet the Government's requirement. The 28,880 target needs a building rate no Essex council has reached, on a jobs-to-homes assumption the Council's own data does not support.
-
Not consistent with national policy. No exceptional circumstances for this site. The land is neither previously developed nor grey belt (the Council's own Green Belt assessment says so). The flood sequential approach was not applied. A road is costed through ancient woodland that national policy says must be refused.
Nobody was asked. Natural England, National Highways, Historic England and the Environment Agency have each confirmed in writing that they were not consulted on the allocation, and each gave advice in 2024 that the plan does not act on (Table S2).
What this representation adds. The Council has no flood model, land budget, site viability test, noise assessment or ecological data for this site. This representation supplies each, with its method, data and limits (Appendices G to Q; Appendix D).
What is asked of the Inspector. The legal and soundness grounds are independent: the soundness grounds rest on the Council's own published findings, and no addendum to the Habitats Regulations Assessment changes them. The representation asks for findings on six legal questions (section 3.6), the modifications at section 2, and participation in the hearings (section 9).
The requests, in one list
Everything this representation asks for is listed here, each with a link to the place in the body where it is made and reasoned. Nothing is asked for anywhere else that is not on this list.
-
Delete Policy SS18 by main modification, and return both parcels, Lower Langdon and Corringham Park Farm, to the Green Belt on the Policies Map, not to safeguarded land (MM1 and MM2, section 2).
-
Make the consequential modifications: Table 1, Table 2 and paragraph 4.2.3, the housing trajectory, the Vision and Policy SP01, Policy DMP11, the Infrastructure Delivery Plan (IDP) and the monitoring framework (MM3 to MM7 and MM9, section 2).
-
Restate the housing requirement: option A, a requirement the plan's own trajectory can deliver, or option B, retain 28,880 and address the shortfall within the period at the first review (MM8, section 2).
-
Reach and record findings, with reasons, on six legal questions: (1) whether the Habitats Regulations Assessment assesses the SS18 allocation at all, (2) whether its water quality conclusion rests on certain and effective mitigation at the Tilbury works, (3) whether no adverse effect on integrity can be ascertained, including functionally linked land, recreation and air quality in combination, (4) whether the Suitable Alternative Natural Greenspace (SANG) is identified with the certainty the Regulations require, (5) whether the sustainability appraisal appraised the adopted strategy as a reasonable alternative, and (6) whether the Council discharged its duties under section 28G of the Wildlife and Countryside Act 1981 and section 40 of the Natural Environment and Rural Communities (NERC) Act 2006 (section 3.6).
-
Be consulted and heard on any addendum to the Habitats Regulations Assessment or the sustainability appraisal, or any further evidence on these matters, before it is determined (section 3.6).
-
Participate in the hearing sessions on every matter, issue and question concerning Policy SS18, the Habitats Regulations Assessment or the sustainability appraisal, and respond to any main modification affecting Policy SS18, including any that would retain it in modified form (section 9).
-
Be notified at each stage: submission, the matters, issues and questions, hearing dates, main modifications and any addendum, the recommendations and adoption (Notification).
-
Have the evidence offered admitted: the Council's evidence base in searchable, page-referenced form, available on request, and the results of the independent ecological survey, if Policy SS18 is kept in the plan, as they become available (section 1).
-
Nothing else. This representation does not ask for the plan to be withdrawn or found unsound as a whole (section 8.8).
Table S1. The topics, the tests each fails, and where the evidence is. The main text is arranged by test. This table is the way in by topic. LC is legal compliance. J, E, CNP and PP are the four soundness tests: justified, effective, consistent with national policy and positively prepared.
Topic |
What the record shows |
Tests failed |
Where |
|---|---|---|---|
The Site of Special Scientific Interest (SSSI) and the Habitats Regulations |
The HRA does not assess the allocation; the whole site is inside the SSSI's Impact Risk Zone, never applied; no visitor, lighting, noise or in-combination assessment; recreational disturbance recorded as an active pressure since 2019 |
LC, J, CNP |
|
Ecology and ancient woodland |
No survey of any kind; Fell-me-down Shaw inside the allocation since confirmed ancient woodland; residents' records of Red List and protected species the Council never gathered; a costed road through ancient woodland in the SSSI |
J, CNP, E |
4.6, 5.4, 6.2, Appendix D |
The Council's own evidence on the land |
Green Belt assessment: "not recommended", not grey belt, and the strongest score in the borough for keeping towns apart; housing land study: "Unsuitable"; the capacity figure written to a target; reinstated after the professional appraisal left it out, with no reason recorded |
J, PP |
|
Housing need and the requirement |
Need is met without SS18; the 28,880 requirement is a choice 34 per cent above need, on a jobs assumption the Council's own data does not support, at a rate no Essex council has reached in a single year |
J, PP |
|
The land budget and capacity |
3,841 homes on the Council's own figures, 2,126 once its own policies are drawn on the land; the policy's 5,000 homes, a target fixed before the capacity work, do not fit |
J, E |
4.4, 5.8, Appendix I |
Flood risk and drainage |
No site model; Flood Zone 3b "should be retained as floodplain"; the Level 2 assessment is an unapproved draft; 19 to 25 hectares of drainage land needed against 6.4 allowed |
J, CNP |
4.6, 6.3, Appendix O |
Viability and affordable housing |
The Council's own study finds the site unviable at the Golden Rules; rebuilt to the pound with land constraints the Council ignored, affordable housing falls from 17 per cent to none; the land £95 million to £102 million short |
E, CNP |
5.2, 5.7, 5.8, Appendix J |
Infrastructure and providers |
£256.6 million costed for 4,000 homes, funded by nobody, confirmed by no provider; National Highways will not take on the A13 and assessed no junction; no sewer, no water allowance, no rail engagement, no adequate health service, no noise buffer, no adequate sustainable drainage systems (SuDS) for land drainage |
E |
|
Access |
The £18.8 million northern road runs onto an unmade private lane at the SSSI boundary and cannot be built as specified without entering the SSSI; the Laindon Road link crosses ancient woodland |
E, CNP |
|
Joint working and consultation |
No statement of common ground with any body; Natural England, National Highways, Historic England, the National Health Service (NHS) and the rail operator never consulted on the allocation; neither water company has confirmed capacity |
E, LC |
|
Delivery and the five years |
Nothing from SS18 in the first five years on the Council's trajectory or the promoter's account; no delivery vehicle, no trigger; already slipping |
E |
|
Noise, light and air |
59 per cent of the allocation above the World Health Organization (WHO) road noise limit on the Government's maps; the noise bund that would deal with it is not provided for and would take the space of 127 homes |
J |
|
Heritage |
The Council's own assessment finds harm that "should be avoided"; never weighed; Historic England never consulted |
J, CNP |
|
Green Belt and grey belt |
Exceptional circumstances not evidenced for this site; the land is neither previously developed nor grey belt; the release sequence not followed; 168 refusals on and around the land since 1948, 20 of them on Green Belt grounds since 2012 |
J, CNP |
4.1, 4.2, 6.1, Appendix L |
The sustainability appraisal |
The adopted strategy was never appraised as an option; the strategy without SS18 scored better on eight objectives; the appraisal contradicts itself on flood and heritage |
LC, J |
|
Cumulative effects |
SS18 never assessed with Corringham, Stanford-le-Hope, Horndon-on-the-Hill, Brentwood's Dunton Hills Garden Village or Basildon's sites on the same roads, hospital, works and SSSI |
LC, J, PP |
Table S2. The four statutory bodies that have confirmed in writing, in answer to this representation's requests, that they were not consulted on the SS18 allocation, and what became of the advice each had given. Each reply is reproduced at Appendix E. The Council's evidence base records none of them. The remaining bodies the allocation depends on (the NHS trust, the rail operator, Essex & Suffolk Water, Essex County Council, Basildon) have no recorded engagement either, and Anglian Water has not confirmed capacity for the site (Table 5.5).
Body, and its role for this land |
What it told the Council before the plan |
What the Council did |
What the body has now confirmed in writing |
|---|---|---|---|
Natural England, statutory adviser on Langdon Ridge SSSI, which the allocation adjoins for 1,075 metres |
February 2024: the site "should not be taken forward until alternative site options have been fully considered"; a visitor survey, habitat assessment and cumulative assessment were needed; it expected to be consulted on any assessment and mitigation |
No survey, no visitor study, no cumulative assessment; the Habitats Regulations Assessment does not mention the site; the Impact Risk Zone Natural England says it expects the Council to use was never applied |
5 October 2026: "no records of any engagement" with the Council on the plan since 1 January 2023; no statement of common ground; nothing on birds, mammals, reptiles, bats or functionally linked land for this site (E5) |
National Highways, operator of the national road network; the plan assumes the A13 will become its road and that it will therefore bear the cost of the capacity the plan needs |
February 2024: asked for a sensitivity test without the Lower Thames Crossing; anticipated adopting the A13 east of the A1089 "within the Local Plan timeframe" |
No sensitivity test; the Infrastructure Delivery Plan lists the A13 handover among its highway schemes and funds every road from developer contributions |
8 October 2026: "no site-specific consultation" on SS18; the A13 east of the A1089 is "not part of the SRN [Strategic Road Network]" and will not be adopted in 2026 to 2031, with no funding; it "has not carried out specific assessments" of the junctions the Council's own study finds over capacity (E6) |
Historic England, statutory adviser on the historic environment |
February 2024: expected site heritage assessments "ahead of the Regulation 19 plan" to decide whether sites are suitable; the Council promised "a comprehensive Historic Assessment" |
The assessment was made and found harm that "should be avoided"; the land was allocated without the assessment being put to Historic England or the harm being weighed |
5 October 2026: no record of being consulted on SS18 before the Regulation 19 plan; not aware of having seen any Heritage Impact Assessment for it (E4) |
Environment Agency, operating authority for the Main River through the site |
February 2024: built development should avoid the site's watercourses and flow paths; risk to Corringham and Stanford-le-Hope downstream must not be increased; the new flood assessment should provide the evidence for considering this site |
The flood assessment is an unapproved draft with no model of the site; the policy treats flood risk as an on-site constraint only and never mentions the towns downstream |
9 October 2026: no record of any consultation on SS18 before the Regulation 19 plan; its detailed model stops at the A13 and the flood zones on the site are broad-scale national mapping that it says needs further assessment before use (E7) |
The pattern is the same in each case: the body gave its advice at the first consultation, the Council did not act on it, and the body was not asked again before the land was allocated. These are the authorities whose agreement the plan will need to deliver the allocation, and the evidence base contains no record that any of them was approached about it.
Extended Summary
1. The allocation and the ask. Policy SS18 allocates about 250 hectares of Green Belt between Stanford-le-Hope, Horndon-on-the-Hill and Langdon Hills for about 5,000 homes, in two parcels: Lower Langdon (housing land study site 60940; 225 hectares, 4,000 homes) and Corringham Park Farm (site 60893; 1,000 homes). The land adjoins Langdon Ridge Site of Special Scientific Interest (SSSI) along its northern edge, lies wholly within the SSSI's Impact Risk Zone, and lies within 8.1 km of the Thames Estuary and Marshes Special Protection Area and Ramsar site. The representation asks for the policy to be deleted and the land returned to the Green Belt (modifications MM1 to MM9, section 2). It does not seek withdrawal of the plan. Section 8.8 says why.
2. Legal compliance (section 3). Three grounds, the first two each enough on their own, and one supporting defect:
-
The Habitats Regulations Assessment (HRA) does not assess the allocation (section 3.1). The policy the HRA calls "SS18" is West Horndon, which is SS17 in the published plan: a South Ockendon policy was dropped and the list renumbered after the consultants were instructed. "Langdon", "Corringham Park" and "north of the A13" appear nowhere in its 324 pages, yet it applies the plan's full housing total. The plan's own Policy DMP23 requires screening within 8.1 km of the estuary, and SS18 confirms the site is inside that zone. The fields carry golden plover, lapwing and curlew, three of the species the HRA names. Regulation 105 is not met: there is nothing to which the test can be applied.
-
The water-quality conclusion rests on the wrong water company. It relies on "the mitigation measures and improvements set out by Southern Water", which serves Kent. Thurrock's sewerage undertaker is Anglian Water, which the HRA never names. Its Tilbury works spilled 44, 56 and 64 times in 2023 to 2025 for lack of "hydraulic capacity", and Anglian Water confirms that no capacity check has been made for the site or the sewers that would carry its sewage there. Mitigation must be certain and effective (People Over Wind; Holohan). Another company's mitigation, in another catchment, is no mitigation for this one.
-
The sustainability appraisal never appraised the strategy the plan adopts (section 3.2). 10,000 homes at West Horndon plus 5,000 at Lower Langdon appears in none of its nine options. The only option containing Lower Langdon, and that at a lower housing number than the plan's (Corringham Park Farm has never been in any assessed strategy), lost to the option without it on eight objectives and won on none.
-
Supporting defect (section 3.3): the appraisal scores flood risk and heritage on the same land as significant negative in one chapter and negligible in another, with no explanation.
-
The Council's own duties, the third ground (section 3.4): section 28G (to further the SSSI's conservation) and section 40 (biodiversity) are addressed nowhere. Natural England asked in 2024 that the site "should not be taken forward until alternative site options have been fully considered" and holds no record of any engagement since.
3. Not justified (section 4). The Framework requires an appropriate strategy, based on proportionate evidence, and Green Belt released only where exceptional circumstances are fully evidenced and justified. On the Council's own evidence:
-
Its Green Belt consultant recommended against the land. Sub-area CS-01, 221 hectares: "Not recommended", harm "Fundamental", "Provisional Grey Belt: No". CS-01 is the only sub-area in the borough to score 5 out of 5 for stopping towns merging.
-
Its housing land study called Corringham Park Farm "Unsuitable" (October 2025) and put Lower Langdon at 3,378 homes, not 4,000.
-
The capacity figure was written to a target. The study was told its figure "must demonstrate capacity exceeding the 4,000-dwelling target". The capacity was predetermined, not evidenced.
-
The land was offered, not found. Both parcels came in through a promoter's call-for-sites submission. The Council's one search of the Green Belt pointed away from them (section 4.1).
-
It was left out twice and reinstated on a promoter's claim of deliverability that has never been published, and the promoter has since told the Council's consultants that the site cannot deliver in the first five years, yet SS18 remains.
-
The site score measured almost nothing. Green Belt, landscape, habitat and the SSSI cost the site nothing in scoring. Its 68.75 out of 100 is a flood score only (Appendix M). Re-scored on the Council's own consultants' findings, SS18 is the only strategic allocation that fails every constraint column.
-
There is no site evidence. No ecological survey, flood model, drainage strategy, air quality assessment, recreational pressure assessment or noise assessment exists. The Council's own heritage assessment found harm that "should be avoided".
-
No reason is recorded. The plan gives none for departing from any of these findings, or from its own record of 168 refusals on and around this land since 1948, 20 of them on Green Belt grounds between 2012 and January 2026.
Grounds: 4.1, 4.2, 4.3, 4.4, 4.5, 4.6. What the decision-makers were told, 4.7.
4. Not effective (section 5). The plan must be deliverable over its period. On the Council's own figures it is not:
-
The land loses money. The Council's viability study values Lower Langdon at minus £9.8 million at the 50 per cent affordable housing the Golden Rules require. The most it can carry is 34 per cent against the plan's 35.
-
The Council ignored its own constraints in the land budget. With them included the site cannot carry the plan's affordable housing (Appendices I and J). It carries 17 per cent at the Council's own capacity of 3,841 homes, 5 per cent with the drainage land its Policy DMP29 requires, and none at all once the ancient woodland and SSSI buffers are drawn. With the A13 noise bund and the greenspace Natural England's standard needs, only 2,126 homes fit and the land is £95 million to £102 million short (Figure 6).
-
Nothing comes in the first five years. The promoter told the Council's consultants so: "discussions have since stalled" and the promoters "are seeking a development partner". SS18 still counts towards a requirement it does nothing to meet, and so puts the plan's five-year supply at risk from the day of adoption.
-
£256.6 million of infrastructure, funded by nobody. Costed for 4,000 homes, not the 5,000 proposed, every line "Developer Contributions", every gap blank. A further £20 million to £80 million for drainage, the noise bund, the greenspace and emergency services is missing from the count, and sewerage, water, buses and land are not priced at all.
-
No provider has confirmed capacity. The hospital was rated inadequate in 2025, yet the plan's infrastructure evidence relies on a "good" rating from 2019. There is no sewer and no water allowance. Rail was never asked. National Highways will not take on the A13, which the plan assumes it will, and has assessed none of the junctions the Council's own study finds over capacity.
-
The northern access cannot be built as costed. The £18.8 million road runs onto a private lane at the SSSI boundary, which would have to be widened into the SSSI, with compulsory purchase of private land. The Laindon Road link crosses ancient woodland.
-
Nobody was consulted. No statement of common ground exists with any body (Table 5.5). Four statutory bodies have confirmed in writing that they were not asked (Table S2).
-
Even if allocated, it could not be consented as drawn. A developer would face refusal before it reached the viability problems above. Under the national decision-making policies in force since August 2026, a road through ancient woodland must be refused, development that harms the SSSI's features should not be supported, and affordable housing below the Golden Rules needs exceptional justification. The policy as drawn requires all three.
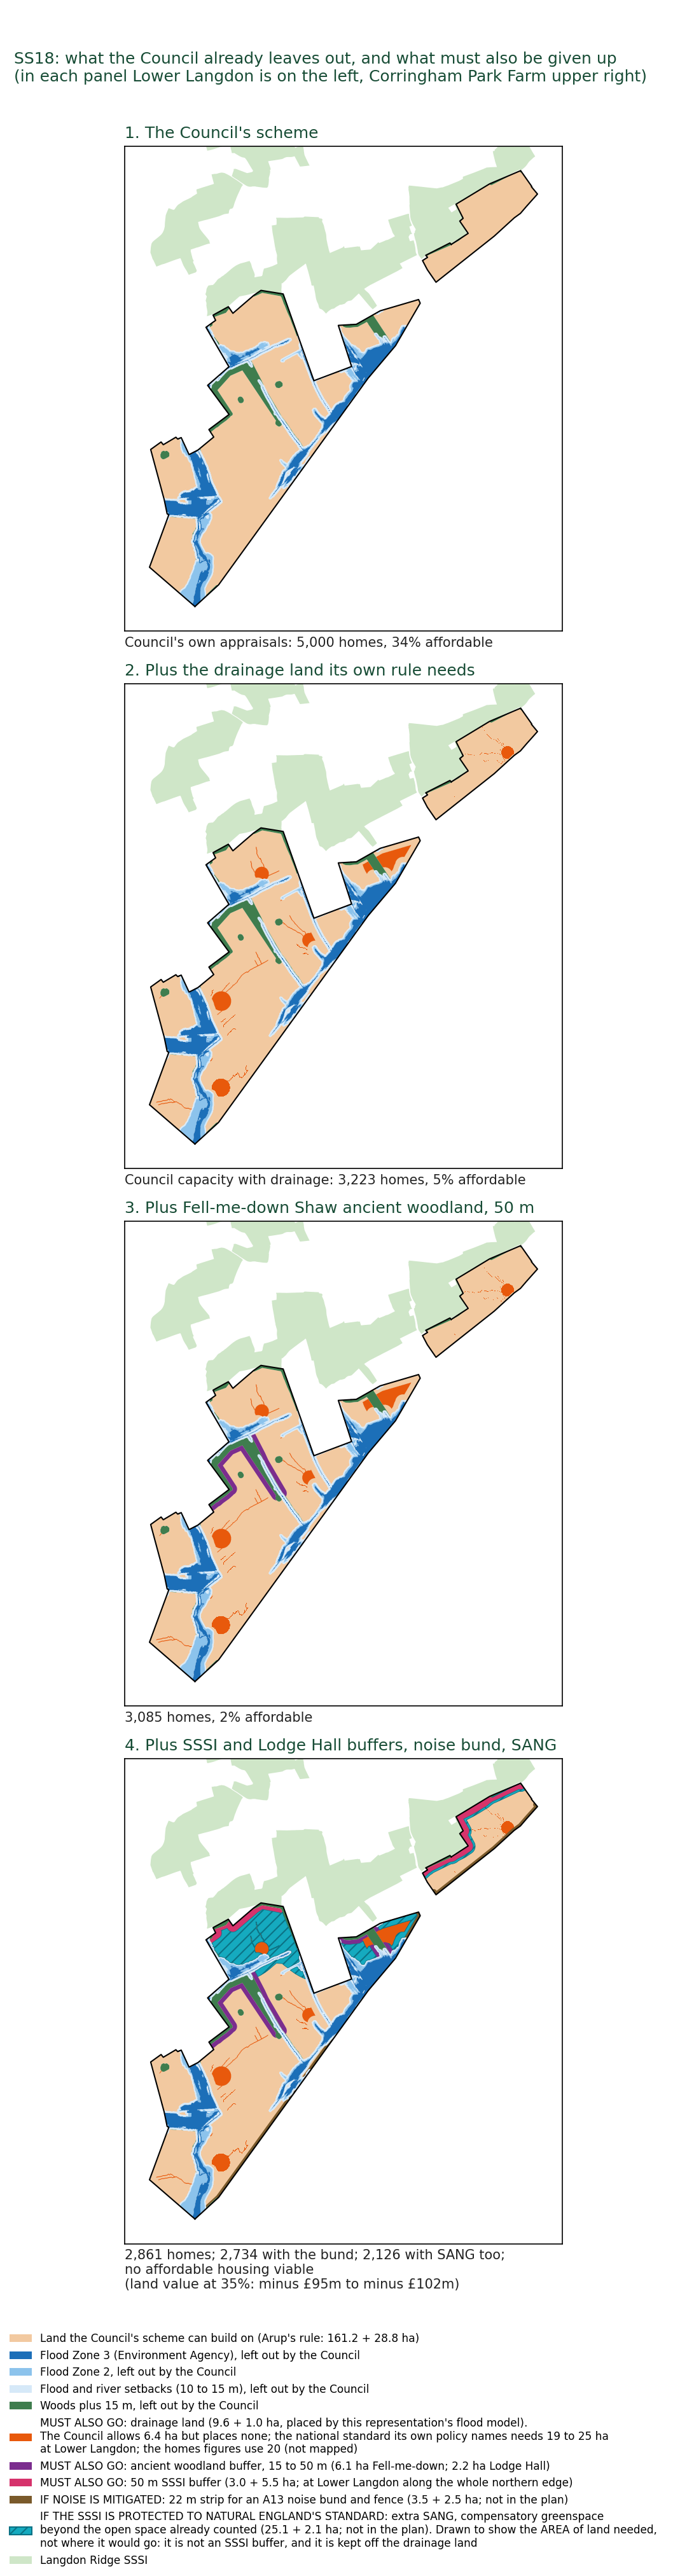
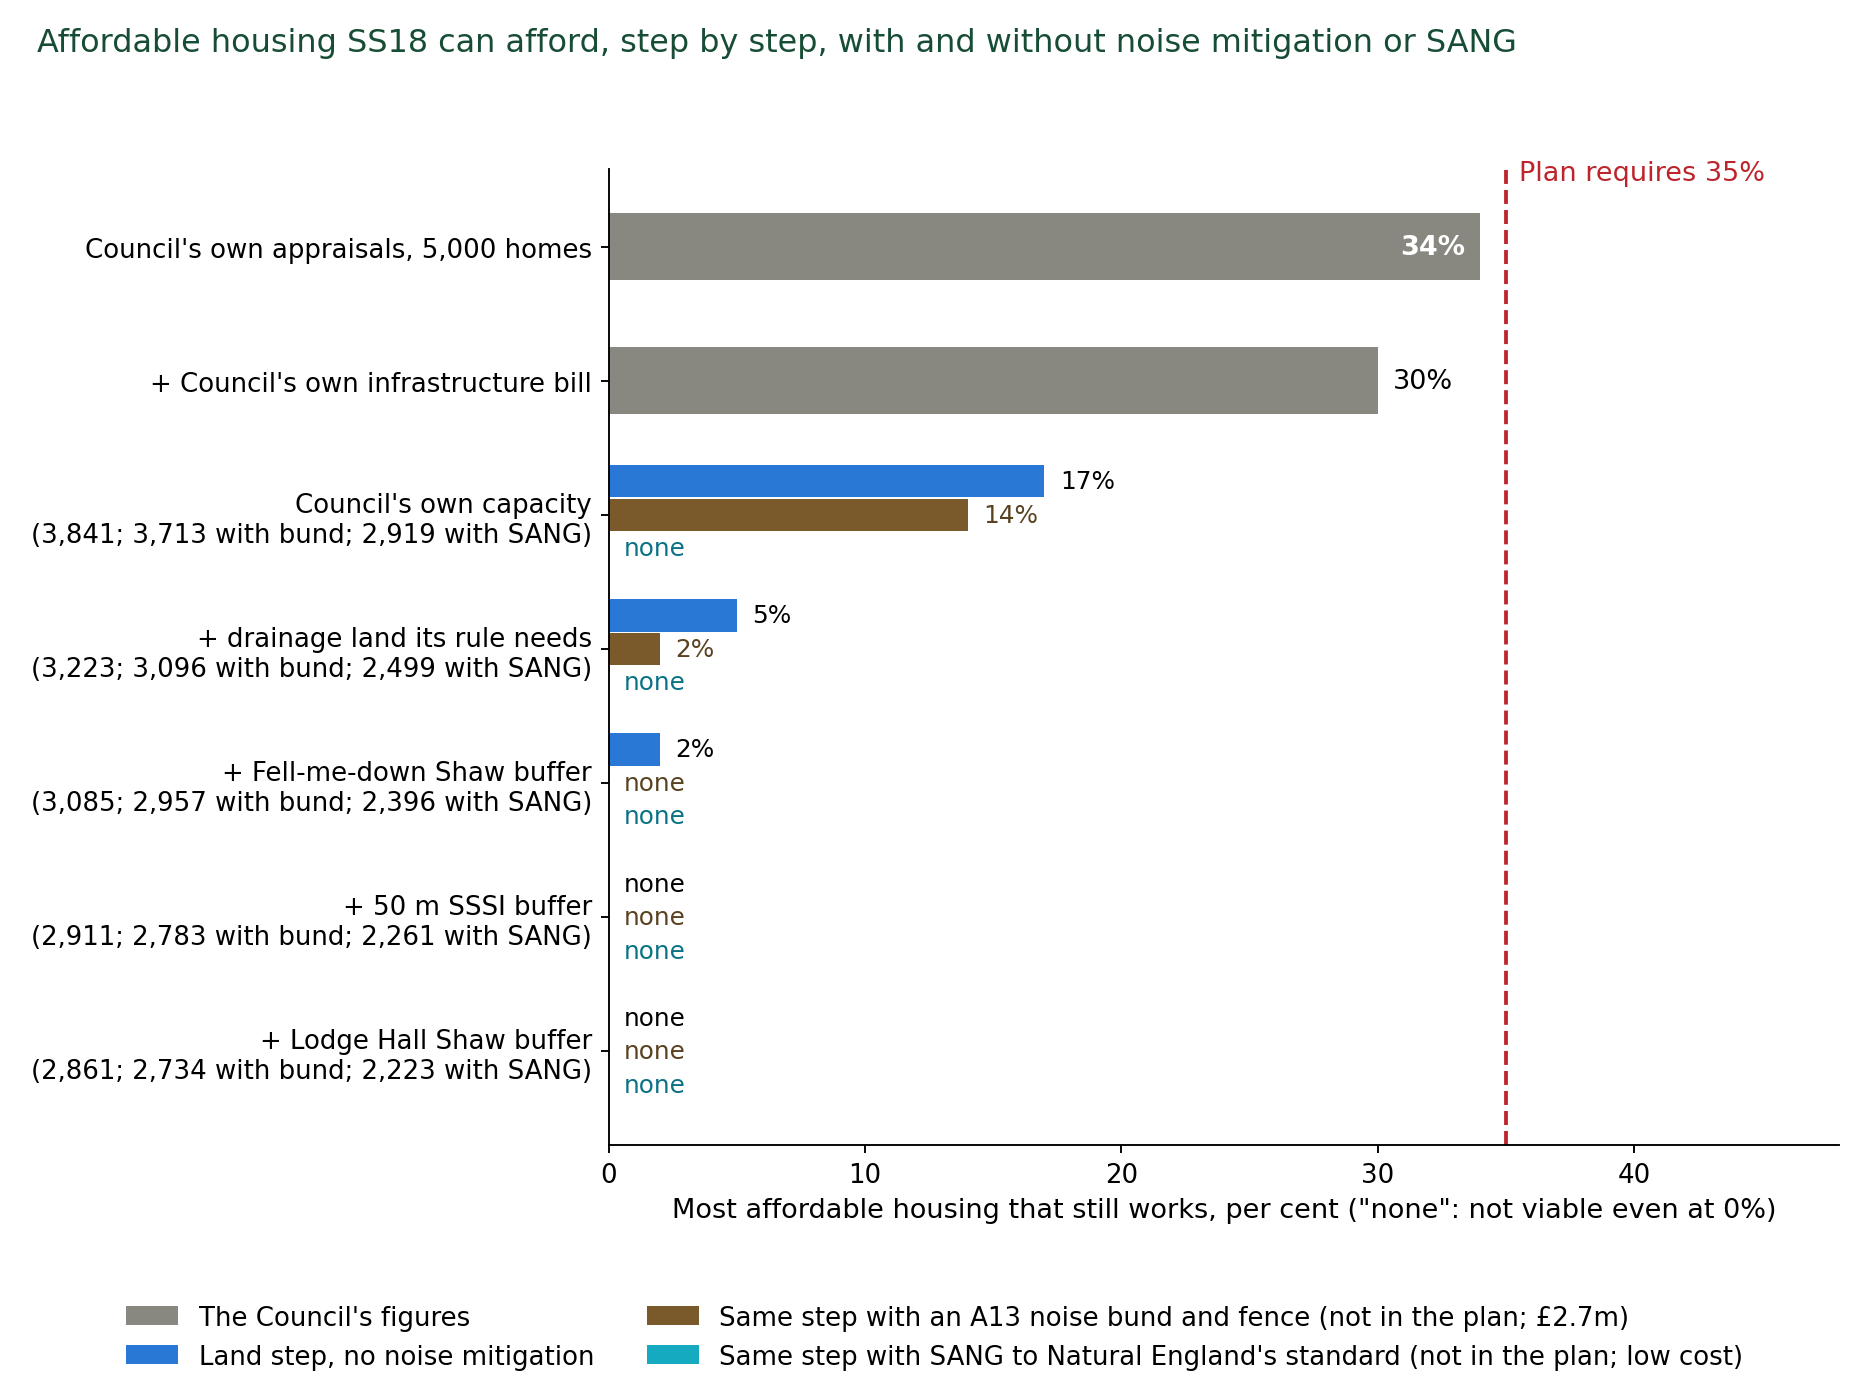
The analyses made for this representation. Where the Council's evidence base is silent, this representation has done the work, with method, data and limits (Appendices G to Q). Each stands on the Council's own data or the Government's, and none depends on the HRA point.
-
Flood and drainage (Appendix O): 19 to 25 hectares of drainage land needed against the 6.4 allowed. This representation's model agrees with the Environment Agency's own model for the brook as it is today. The Agency's detailed model stops at the A13, so no detailed flood model of this land existed until now. This representation's model, built in EPA SWMM 5 and HEC-RAS 7, the software the Environment Agency and the drainage industry use, covers the whole catchment that drains through SS18.
-
Land budget (Appendix I): 3,841 homes on the Council's own capacity figures (its housing land study's 3,378 for Lower Langdon and its consultants' 463 for Corringham Park Farm), falling to 2,126 as the constraints its own policies require, and its capacity study ignored, are drawn on the land.
-
Viability (Appendix J): affordable housing falls from 34 per cent to none, and the land £95 million to £102 million short of the land price the Council's own test requires, that is, the value left for the land after every cost and the developer's profit, with every home sold.
-
Noise (Appendix Q): 59 per cent of the allocation already above the World Health Organization's limit for road traffic noise. The Council's own 2023 Initial Proposals said the A13 would limit the developable area and that noise would have to be addressed. The 2026 plan, the policy and the capacity study say nothing about it.
-
Need and delivery (Appendices G and H): the 'jobs-need-homes' premise is contradicted by the borough's record, and the plan's housing figure is far higher than its own jobs forecast supports. No council in Essex has ever built at the required rate in a single year, and only two councils in England have sustained it over twenty years.
-
Site selection and alternatives (Appendices M and N): SS18 is the only allocation failing every constraint. The Council's own housing land study holds 17,055 homes of suitable, available and achievable capacity that the plan does not allocate.
-
Ecology (Appendix D): species records from the land itself, which no Council document holds.
5. Not positively prepared, and not consistent with national policy (sections 6 and 7).
-
The homes are not needed: The Government's minimum is 21,480 homes over 2024 to 2044. Without SS18 the plan provides 22,006 in the period.
-
The 28,880 target is a choice: 34 per cent above the minimum, on a jobs scenario the Council's own consultant says "would not be necessary" for baseline growth. The Government's own minimum has fallen, from 1,177 homes a year in 2022 to 1,071 to 1,077 under the December 2024 method, while the Council's target rose.
-
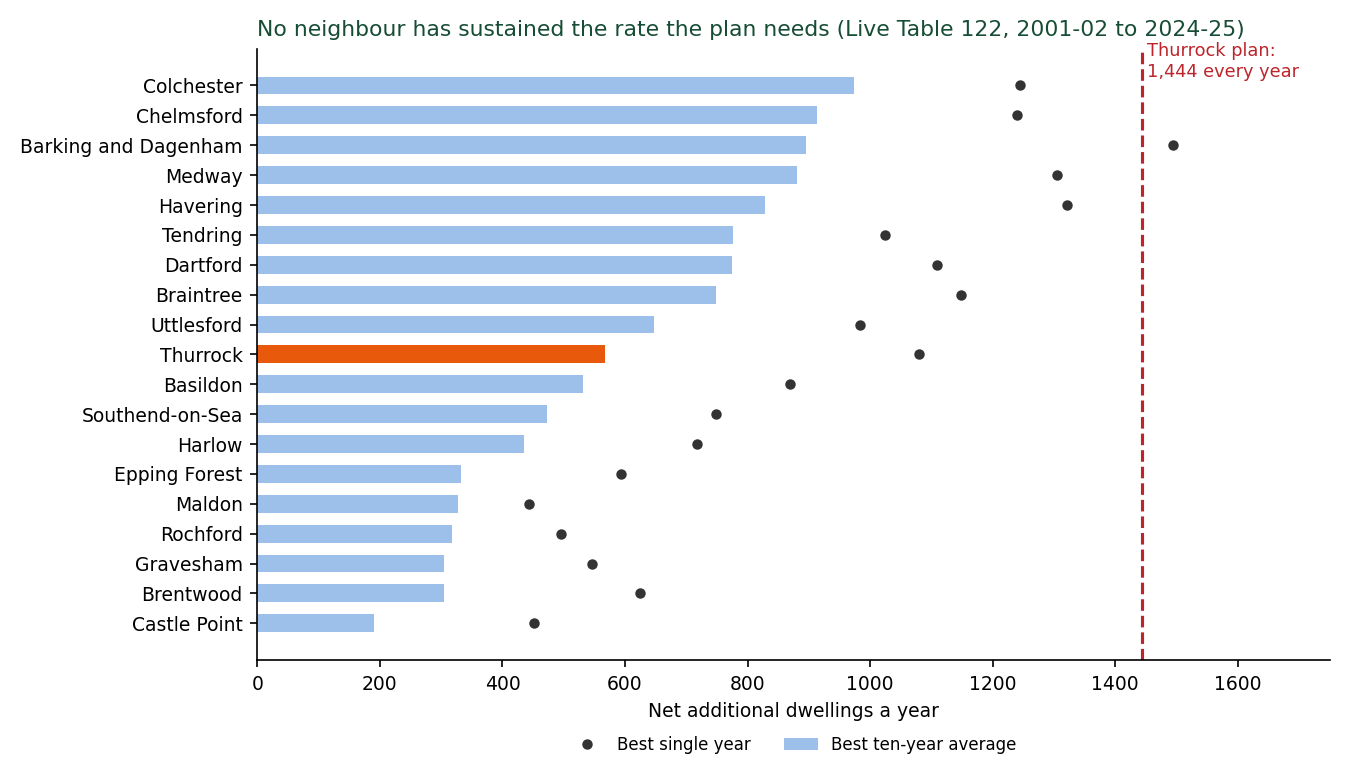
Nobody has built at that rate: It needs 1,444 homes a year for twenty years, which is 2.5 times the borough's best decade, a rate no council in Essex has reached in a single year. With no committed developer for SS18, there is no evidence that the rate can be reached.
-
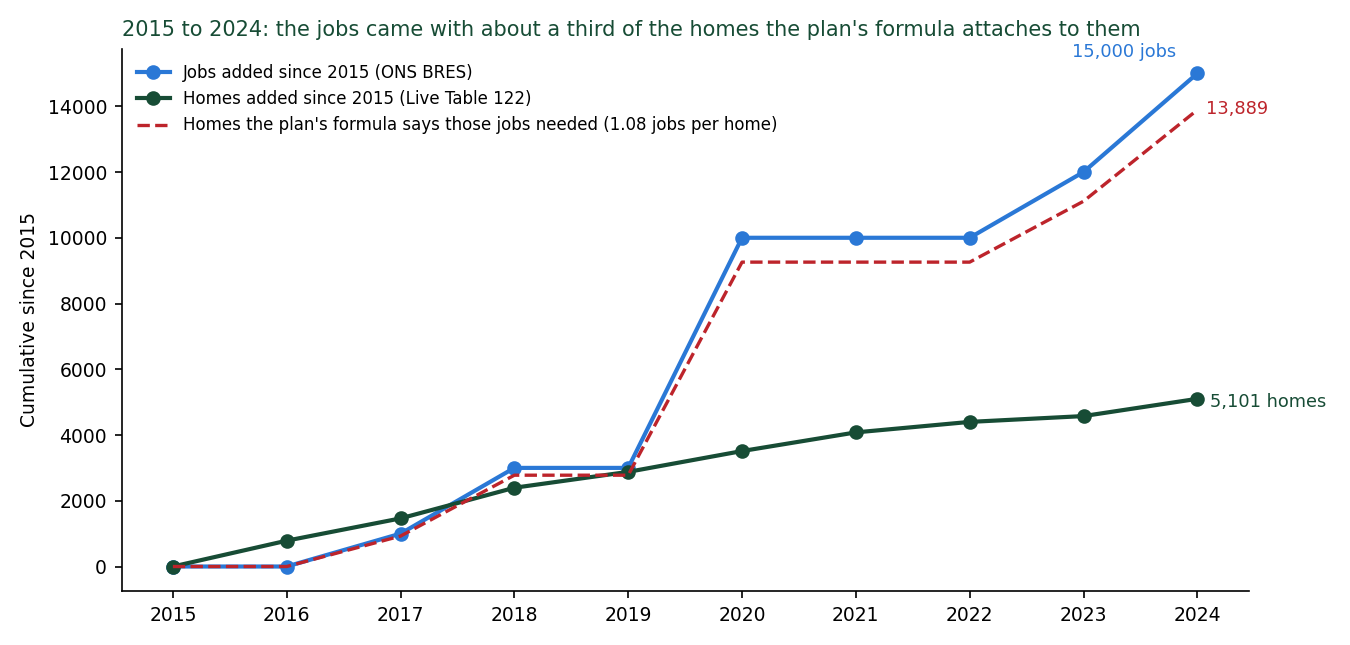
Its premise fails on the Council's own data: The Council assumes each new job needs a new home in Thurrock, ignoring the commuters who fill many of them. The borough added about 15,000 jobs and 5,100 homes in 2015 to 2024. The number of jobs created is not proportionate to the number of homes needed to house the people who fill them. The Council ignored its own record, which would have given an accurate forecast of how many homes its jobs need: applied to its own jobs forecast, that record gives about 10,600 homes, not 28,880 (section 4.5; Appendix G).
-
The alternatives were never examined: The Council made no active search for brownfield land. Its only reason for releasing Green Belt is that brownfield is "limited", and that rests on a register it has not reviewed since April 2024, although the law requires a review every year. Three quarters of the homes on that register (2,850 of about 3,800) are on one site, Purfleet Centre. There is no urban capacity study and no density test. The countryside charity CPRE's 2026 survey of every council's register finds room for at least 1.54 million homes on brownfield land in England [147]. The Council's own housing land study holds 17,055 homes on 79 suitable sites it does not allocate, about 2,450 of them outside the Green Belt or on previously developed land within it (section 4.1; Appendix N). It is likely that if the Council undertook a proactive brownfield search this number would increase.
-
National policy is not followed: No exceptional circumstances for this site. The land is neither previously developed nor grey belt. The flood sequential approach was not applied, and the draft flood assessment says Flood Zone 3b "should be retained as floodplain". A road is costed through ancient woodland that national policy says must be refused.
-
Nothing was assessed together: SS18 sits beside about 3,300 more homes allocated at Corringham, Stanford-le-Hope and Horndon-on-the-Hill, on the same roads, hospital, sewage works and SSSI, and across the A127, Brentwood Borough Council has resolved to grant outline permission for up to 3,700 homes at Dunton Hills Garden Village. No document assesses them together (section 7.5).
6. The remedy, and why a cure will not work (section 8). The Inspector may recommend main modifications to make a plan sound (Planning and Compulsory Purchase Act 2004, section 20(7C)).
-
A cure would need everything that does not exist: a Habitats Regulations Assessment that assesses this site and the sewage works that would receive its waste water, a sustainability appraisal that tests the strategy the Council adopted against the alternatives it rejected, a reasoned explanation of why the Council has departed from its own Green Belt and housing land findings, a flood model, an ecological survey across all seasons, a drainage strategy, a noise assessment, an access road that can be built, confirmation from the infrastructure providers and a viability appraisal that shows the site can pay its way. Any addendum would have to report what the Council's consultants have already found.
-
Deletion needs nine modifications, all drafted (section 2). It leaves a plan above the Government minimum that matches the strategy the Council's own appraisal preferred, removes £256.6 million of unfunded infrastructure and keeps the Green Belt that the Council's own consultant scored highest in the borough for keeping towns apart and said should not be released.
-
There is precedent: Greater Norwich (2024), North Essex (2020) and Uttlesford (2020) (section 8.5). Seventeen answers the Council is likely to give are dealt with in section 8.6.
7. Findings sought, and the record. The representation asks the Inspector to reach and record findings, with reasons, on six legal questions (section 3.6):
-
whether the HRA assesses the allocation.
-
whether its water-quality conclusion rests on certain and effective mitigation at the works that will receive the plan's sewage.
-
whether no adverse effect on integrity can be ascertained, including through functionally linked land, recreational pressure and air quality in combination.
-
whether the SANG is identified with the certainty the Regulations require.
-
whether the sustainability appraisal appraised the adopted strategy as a reasonable alternative and gave reasons.
-
whether the Council discharged its duties under section 28G and section 40.
It asks to be consulted and heard on any addendum before the matter is decided. These grounds are raised now so that they are before the Inspector with the evidence for each. They are the grounds on which the lawfulness of the plan, if adopted with SS18 without those findings, would fall to be tested under section 113 of the 2004 Act. The 162 defects are scheduled with the test each fails (Appendix F). The Council's evidence base is offered in searchable form and is available on request.
Detailed summary: the fifteen findings
What I ask for. Delete Policy SS18 by main modification. Return both parcels, Lower Langdon (Parcel a, 4,000 homes) and Corringham Park Farm (Parcel b, 1,000 homes), to the Green Belt on the Policies Map [2], not to safeguarded land. Make the consequential changes in section 2. The rest of the plan proceeds.
The main finding. The Council's own viability study [29] finds the site unviable: on Parcel a the land is worth minus £9.8 million at the 50 per cent affordable housing the Golden Rules require on land released from the Green Belt, and the most it can carry on the Council's own figures is 34 per cent, against the 35 per cent the plan sets.
That is before the constraints the Council's own policies impose are drawn on the land.
Rebuilt from the Council's own printed appraisals: at the Council's own capacity of 3,841 homes, not the predetermined and unevidenced 5,000-home target, the site supports 17 per cent affordable housing. With the drainage land its own Policy DMP29 requires set aside, 5 per cent. With the buffers to the ancient woodland and the SSSI, no affordable housing is achievable, and the land is worth minus £39 million at the plan's 35 per cent.
Add the A13 noise bund the plan does not provide for and the SANG that Natural England requires of every other housing scheme beside this SSSI, and 2,126 homes fit, no affordable housing is viable on any land price test, and the land is £95 million to £102 million short. "Short" means that, at the plan's 35 per cent affordable housing, the money the homes sell for does not cover the cost of building them, the infrastructure and a normal developer's profit. The gap is £95 million to £102 million, the range depending on the cost of the SANG, before the landowners are paid anything at all.
A 5,000-home allocation that delivers about 2,100 homes when properly budgeted and no affordable housing, on land the Council's own consultant scored higher than any other sub-area in the borough for keeping towns apart, while the statutory habitats assessment never looked at it: that is what this representation shows.
Every figure is the Council's or is derived from the Council's, and sections 4.4 and 5.2 and Appendices I and J set out each step.
The pattern. The record also shows how the policy was made. The allocations were "prepared by Thurrock Council officers in early 2026 and approved by Council members following the 2026 local elections" (IDP [30], page 166). The viability work was based on a February 2026 draft and a site list supplied in May 2026. The evidence base was uploaded between 12 and 19 August 2026, the Cabinet approved the plan on 26 August, and the housing land methodology was posted on 1 September, the day before the consultation opened. The habitats assessment is numbered to an earlier draft of the plan and misses the site. The sustainability appraisal never appraised the combination adopted. The flood assessment is an unapproved draft. The infrastructure is costed for 4,000 homes against a 5,000-home policy. The capacity study was written to demonstrate a predetermined target. No ecological survey, flood model, drainage strategy or provider confirmation exists. The land had been rejected twice by the Council's own assessments before it was allocated. The statutory bodies were left out in the same way. Natural England, the Environment Agency and Historic England all responded on this land at Regulation 18 in February 2024, and the further assessment they asked for was never done. Natural England, the Environment Agency, Historic England and National Highways have each confirmed in writing that the Council did not consult them on the SS18 allocation before the Regulation 19 plan was published. There is no statement of common ground with any of them (section 5.5).
None of this requires any finding about motive. It is the pattern of a plan assembled in haste to a fixed submission date, and it is why the tests of soundness, which ask whether the policy is justified by evidence, cannot be met. (Sections 3.2, 4.3, 4.6, 4.7 and 5.3)
The five points on which it falls. First, the statutory habitats assessment does not assess the site: legal compliance (Habitats Regulations 2017, regulation 105). Second, the sustainability appraisal never appraised the strategy the plan adopts, and the version with Lower Langdon lost the comparison it did make: legal compliance (regulation 12 of the Environmental Assessment of Plans and Programmes Regulations 2004, the SEA Regulations) and justified. Third, the Council's own evidence rejected the land twice, "Not recommended" with "Fundamental" harm, and not grey belt, from its Green Belt consultant and "Unsuitable" from its housing land study, and the plan gives no reason for overriding either: justified. Fourth, the site is unviable on the Council's own appraisal, its promoter does not expect to deliver in the first five years, and its infrastructure is costed for 4,000 homes, funded by nobody and confirmed by no provider: effective. Fifth, the homes are not needed: without SS18 the plan still provides 22,006 homes in the period against the standard method need of 21,480, and the Council's own housing land study holds the replacement: positively prepared and justified.
Either of the first two makes the plan with Policy SS18 not legally compliant. Any one of the other three makes the policy unsound. The fifteen findings below set out the evidence for each.
Why: the facts, from the Council's own documents.
-
The statutory habitats assessment does not assess the site. The Council's Habitats Regulations Assessment [11] (LUC, 31 July 2026, 324 pages) contains zero occurrences of "Langdon", "Corringham Park" or "north of the A13".
Its entry headed "Policy SS18" is West Horndon (page 285): from SS14 onwards the HRA's policy numbers run one behind the plan's, as they would if a policy was dropped from the list after the consultants were instructed. How that happened is for the Council to explain.
The HRA applies the full 28,880-home requirement while omitting the 5,000-home allocation. The HRA states that "a conclusion of no adverse effect on integrity cannot be reached" even for the seventeen sites it did assess.
The plan's own Policy DMP23 (page 330) requires screening of every residential development within 8.1 km of the Thames Estuary and Marshes Special Protection Area (SPA). Policy SS18 (page 292) confirms the site is inside that zone.
What the law requires: regulation 105 of the Conservation of Habitats and Species Regulations 2017 requires the Council, before it gives effect to a plan likely to have a significant effect on a European site, to make an appropriate assessment of the plan's implications for that site, to consult Natural England on it, and to give effect to the plan only after ascertaining that it will not adversely affect the site's integrity.
How it was not met: the assessment the Council made does not contain the SS18 allocation, so no appropriate assessment of a 5,000-home settlement inside the 8.1 km zone has been made, Natural England has not been consulted on one, and the Council cannot ascertain what it has not assessed. Regulation 105 is therefore not complied with for Policy SS18.
Fails: legal compliance (Habitats Regulations 2017, regulation 105). (Section 3.1)
And its conclusion on sewage relies on the wrong water company. For the same SPA and Ramsar site the HRA screens in the risk from treated sewage and storm overflows, then concludes no adverse effect "providing that the mitigation measures and improvements set out by Southern Water are followed" (PDF page 125): Medway overflows, Motney Hill, Gravesend, Canterbury, Sandwich, all in Kent.
Thurrock's sewage is treated by Anglian Water at Tilbury. Across the whole HRA it never names Anglian Water or the Tilbury works.
The Environment Agency's own returns record that the Tilbury works' inlet overflow spilled 44, 56 and 64 times in 2023, 2024 and 2025, rising each year, 2.1 km from the Ramsar site, for a reason Anglian Water gives as "Hydraulic capacity". Its permit sets no nitrogen or phosphorus limit.
For the whole plan, there is no mitigation for the pathway the HRA itself identified, and SS18 would send its sewage to the same works. (Section 3.1)
-
The strategy the plan adopts was never appraised, and the SS18 version with no Corringham Park and a smaller Lower Langdon ranked almost bottom. The Integrated Impact Assessment [8] tested nine options (Table 2.2, page 53). The adopted combination, 10,000 at West Horndon plus 5,000 at Lower Langdon, is in none of them. Corringham Park Farm is in none of them at any figure.
The IIA tested two high-growth options. Option HG1 put all 10,000 new-settlement homes at West Horndon. Option HG2, the only option containing Lower Langdon, put 5,000 at West Horndon and 3,941 at Lower Langdon. HG2 scored worse than HG1 on eight objectives (transport, air, climate, resources, water, biodiversity, heritage and landscape) and better on none (paragraphs 4.73 to 4.80).
The 2023 appraisal ranked the two-new-town strategy (Spatial Option 5: West Horndon at 7,000 homes and a smaller new settlement of 4,000 at "North Stanford", the Lower Langdon land) fifth of its six options. The 2026 appraisal's preferred strategy "did not take forward Lower Langdon". It was "brought back into consideration because of the increased housing requirement being tested" and on a promoter's "demonstration" of delivery that has never been published (paragraph 2.61).
Neither reason justifies the reversal. Testing a higher requirement does not make a site that lost the appraisal sound: the requirement is the Council's own choice above need, resting on a jobs forecast that section 4.5 shows does not translate into housing demand on the borough's own record. No justification for SS18 is given in any form that stands up to scrutiny.
Importantly, no document records what the promoter 'demonstrated', to whom, or on what evidence. In fact the Council's viability consultant records that the promoters returned no figures, that discussions "have since stalled", and that the site was not expected to deliver in the first five years of the plan. An allocation cannot be justified by an unpublished assurance that was never tested for viability.
What the law requires: regulation 12(2) and (3) of the Environmental Assessment of Plans and Programmes Regulations 2004 require the environmental report to identify, describe and evaluate the likely significant effects of the plan and of reasonable alternatives, and Schedule 2, paragraph 8, requires an outline of the reasons for selecting the alternatives dealt with.
How it was not met: the strategy the plan adopts, 10,000 homes at West Horndon and 5,000 at Lower Langdon, was never one of the alternatives evaluated, so its effects were never identified, described or evaluated against the others. No reason is given for choosing this untested housing strategy over the alternative strategy without Lower Langdon that the Council's own appraisal preferred. Regulation 12 is therefore not complied with.
Fails: legal compliance (SEA Regulations 2004, regulation 12), justified. (Section 3.2)
-
The Council's Green Belt consultant said 'no', in the strongest terms available. Stage 2 Green Belt Assessment [12] (Arup, February 2026), sub-area CS-01, 221.46 hectares: "Not recommended for further consideration". Contribution "Strong". Harm "Fundamental". 5 out of 5 for preventing towns merging, the only sub-area in the borough to score 5 on that purpose. Release "would lead to the physical merging of neighbouring towns". The new boundary "would not meet the NPPF [National Planning Policy Framework] definition". "Provisional Grey Belt: No".
The Corringham Park Farm sub-areas CS-11 and CS-28: both "Not recommended". Every hectare of SS18 was recommended against. The plan gives no reason for departing from that advice. Re-scored on the Council's own consultants' findings, in an analysis made for this representation (Appendix M; report/SITE-SELECTION-RESCORE-NOTE-2026-09-23.md), SS18 is the only one of the nine strategic allocations that fails every column: Green Belt, grey belt, heritage, Flood Zone 3, future flood extent and Main River.
The plan releases about 848 hectares its consultant recommended against, more than the 816 hectares the consultant said could be considered at all. Between 2012 and January 2026 the Council itself refused 20 applications on and around this land (extensions, outbuildings, caravans and single houses) because each would harm the openness of the Green Belt. Seven months later it allocated 5,000 homes on it. No exceptional circumstances are set out anywhere in the plan or its evidence to justify that reversal, as NPPF paragraph 145 requires before Green Belt boundaries are altered. And, as finding 11 shows, the homes it would provide are not needed to meet the borough's assessed need.
Fails: justified, consistent with national policy (NPPF paragraphs 145 to 148). (Sections 4.1, 4.2)
-
The Council's own housing land study classed the first phase "Unsuitable". HLAA [38] site 60893, Corringham Park Farm and Hovels Farm, October 2025: "Unsuitable - Proximity to settlement ... considered to be unsuitable for development". Ten months later, within the preparation of this same plan and with no new assessment published in between, Corringham Park Farm (site 60893) is the founding phase of a 5,000-home settlement.
The Lower Langdon parcel (site 60940) was assessed at 3,378 homes. The policy allocates 4,000. The capacity study [14] that produced 4,041 was instructed that its figure "must demonstrate capacity exceeding the 4,000-dwelling target" and assumed the site "having been identified by TC [Thurrock Council], is considered developable". The same study says 1,000 homes at Corringham Park Farm "falls below best-practice standards" and puts its capacity at 463.
A capacity figure produced to an instruction that it must exceed a target is not evidence for total housing capacity. It is the target restated. The justified test asks whether the policy rests on proportionate evidence, and a figure written to order cannot meet it.
The SSSI shares 1,075 metres of boundary with Corringham Park Farm, the whole of that parcel's northern edge, and 91 per cent of the parcel lies within 250 metres of it. Deducting only the land the capacity study did not already leave out, at the Council's own densities, the homes fall step by step: 3,841 at the Council's own capacity. 3,223 with the drainage land its own Policy DMP29 requires. 3,085 with a 50-metre buffer to Fell-me-down Shaw. 2,911 with a 50-metre buffer to the SSSI. 2,861 with the Lodge Hall Shaw buffer. 2,734 with the A13 noise bund. 2,126 with the SANG to Natural England's standard (section 4.4; Appendix I).
-
The site is unviable, and its promoter says it will not deliver. Viability Assessment [29] (AspinallVerdi, June 2026, Table 8.2): residual land value on Parcel a (Lower Langdon, site 60940) minus £9,802,648 against an existing use value of £5,344,773. Parcel b (Corringham Park Farm, site 60893) minus £913,632. "The site is shown to be unviable with the inclusion of 50% affordable housing (in line with the Golden Rules)" (8.65). The Golden Rules (NPPF December 2024, paragraphs 156 to 157, the Framework this plan is examined against) require 15 points above the local 35 per cent, so 50 per cent, on land released from the Green Belt. The maximum the site can carry is 34 per cent.
The promoters, met on 21 May 2026, returned no figures: "no site-specific viability testing has been undertaken" (8.64), and "discussions have since stalled" (8.63), the discussions being the Council's with the promoters, who had no developer. The consultants record that "it was not expected that the site could contribute to housing delivery in the first 5 years of the plan" (8.67). One landowner "has total control" and the promoters "are seeking a development partner" (8.68). The trajectory still counts 600 homes from SS18 in 2029/30 to 2033/34 (the plan's Appendix 2, page 415), which the promoter's own statement does not support: measured from adoption in 2028, the first five years run to 2033, and all 600 fall inside them.
Rebuilt from the Council's own printed appraisals for both parcels, our analysis shows SS18 supports at most 34 per cent affordable housing on the Council's own figures, 30 per cent with the Council's own infrastructure total, and 17 per cent at the Council's own capacity of 3,841 homes. No affordable housing is achievable once the land the Council's own drainage, ancient woodland and SSSI policies require is set aside. That land is the drainage land the national SuDS standard and Policy DMP29 require, the buffers to the ancient woodland and the SSSI, the A13 noise bund and the SANG to Natural England's standard. The drainage alone shows the size of the gap. The Council allows 6.4 hectares for drainage. This representation's drainage model finds that 19 to 25 hectares are needed. The Council's allowance is therefore 66 to 74 per cent short of the land, and it holds only about 39 per cent of the water the standard requires (Appendix O).
These figures are from the land budget and viability analyses made for this representation, set out step by step with their limits in Appendix I (land) and Appendix J (viability). A bund and fence to deal with the A13's noise, which the plan does not provide for, would cost £2.7 million to £6.5 million and leave 2,734 homes (Appendix Q). Protecting the SSSI to the standard Natural England has applied to housing schemes beside this SSSI, 8 hectares of SANG per 1,000 new residents, which it calls "a robust standard" [138] (section 4.6 sets out its advice on the schemes at Laindon and Vange), needs about 27 hectares more land than the open space the capacity study already provides, and leaves 2,126 homes, with the land £95 million to £102 million short at the plan's 35 per cent and no affordable housing viable on any land price test (Appendix I and Appendix J).
-
Nobody has said who pays. The IDP's own summary puts Lower Langdon's infrastructure at £256,596,000 (Tables 13-3 and 13-4).
The viability study spread it across 5,000 homes (£51,325 each) although the schedule is costed for 4,000, and appraised Corringham Park Farm at a generic £30,000 a home: based on the Council's own figures the correct figure is £64,149 a home, before water, sewerage, rail, buses, the SANG or land are considered (which the plan leaves out of calculations).
The One Tree Hill bridge is £15 million in one Council document and £22.5 million in another. Every item in the Lower Langdon schedule of the Infrastructure Delivery Plan [30] is funded from "Developer Contributions". The "Potential Gap" column is blank throughout. The schedule is costed for 4,000 homes and 9,600 people, not 5,000 and 12,000. Corringham Park Farm appears in it only as a destination of the two bus routes and the end of the east to west road. The borough-wide police (£21.0 million) and fire (£11.8 million) contributions are "Unfunded". Water is "Unknown". The two bus routes and the SANG are uncosted.
What the bill leaves out can be partly priced from the public record: the surface water drainage system the Council's own policy requires (at a larger scale than the Council allows) and its maintenance, the A13 noise bund, the SANG to Natural England's standard, and the police, fire and ambulance contributions the IDP itself seeks per dwelling, together £20 million to £80 million more than the Council has counted (Appendix J, "What the Council's bill leaves out"). Foul sewerage from a site with no sewer, water supply, the two bus services, the healthcare premises, land acquisition and inflation cannot be priced from anything the Council has published, but each adds millions more to the uncosted bill. The source of all contributions is a site with a negative land value of £9.8 million. When SS18 is properly budgeted against the required constraints in its land budget, and infrastructure costs are properly considered, the site is far from viable.
Fails: effective. (Section 5.3)
-
No provider has confirmed capacity. The NHS Integrated Care Board (ICB) records general practitioner (GP) floorspace already short in every Primary Care Network (Stanford-le-Hope minus 937 square metres), five practices in twenty-six with spare space, and states it "is not funded to act as a property developer", meaning the NHS will neither build nor pay for the premises and the developer must provide them. The policy provides "approximately 600 sqm" for 12,000 people, below one surgery (IDP: "New GP surgeries usually have an NIA [net internal area] of 700-1,000m2"). Basildon Hospital, the acute hospital for the whole borough, was rated inadequate by the Care Quality Commission on 15 October 2025, with urgent and emergency care inadequate and conditions imposed on its registration. The IDP in the Council's evidence base, published nine months later, describes Basildon Hospital by its outdated 2019 "good" rating.
The inadequate rating had been public for nine months when the IDP was published, and the IDP cites the 2019 inspection as "the most recent". The IDP's section on acute care (9.6.2) says only that the closure of Orsett Hospital is paused. It assesses no effect of the plan's 35,906 homes, about 86,000 people at its own 2.4 a home, on Basildon Hospital, and proposes no new or enlarged acute capacity anywhere. Twelve thousand people imply some 3,700 to 5,600 more accident and emergency (A&E) attendances a year. "A&E" appears nowhere in the evidence base, and there is no evidence that the Council asked the NHS about hospital capacity at all. Mid and South Essex NHS Foundation Trust, which runs Basildon Hospital, is not on the Consultation Statement's list of bodies consulted, and no document in the evidence base records any exchange with it on acute capacity (my own request to the NHS is in Appendix C).
c2c and Network Rail were not engaged on 361 additional peak-hour rail trips. The A13/B1007/A1014 junction goes from 84.95 to 102.55 per cent of capacity. Mitigation: "N/A - junction identified for further monitoring". Monitoring is not mitigation: on the Council's own model the junction is over capacity with the plan's growth alone, before any growth across the Basildon boundary is counted, and no scheme, cost or funder is identified for it. At Cabinet on 26 August a member asked twice whether providers had confirmed capacity. The question was not answered.
Fails: effective. (Section 5.3)
-
The costed access runs onto an unmade lane at the SSSI boundary and through ancient woodland. £18,758,628 for a 4.1-metre bus and lorry road passing through SS18 and up "onto South Avenue", an unadopted Plotlands lane whose northern verge is SSSI unit 22.
The lane is private, in multiple ownerships, and lined by occupied homes and equestrian holdings. A bus road onto it means acquiring that land by agreement or compulsory purchase, and no Council document identifies the land, the owners, the cost or the mechanism. A visit to the lane makes the point: there is no room for a bus road without taking the land the homes and holdings stand on (Photographs 1 and 2).
A further £3,000,000 is stated for a "potential" link to Laindon Road drawn through Great Sutton Wood, ancient woodland inside the SSSI, which the Council's own Site Selection Methodology [37] lists as an absolute constraint and which NPPF paragraph 193(c) and national policy N6(2) say "should be refused".
Fails: effective, consistent with national policy (NPPF paragraph 193(c)). (Section 5.4)
-
The land is inside the SSSI's Impact Risk Zone and no assessment of the effect on the SSSI exists. Natural England confirmed on 17 September 2026 (Appendix E, item E1) that the Impact Risk Zone is the screening tool the Council is expected to use. The Site Selection Methodology does not mention it.
Natural England's register records "Recreational Disturbance" as the SSSI's only active pressure, since 12 September 2019. The SSSI is 80.5 per cent "unfavourable recovering". Four of its eleven favourable units lie along the allocation's northern edge.
Natural England said at Regulation 18 the site "should not be taken forward until alternative site options have been fully considered", and that "additional assessment should be undertaken of impacts".
No ecological survey of any kind, no visitor study, no lighting, noise or air assessment has been done. The IIA itself says biodiversity effects "cannot be determined at this strategic level". An appraisal that cannot determine the effect on biodiversity cannot support the release of Green Belt land that adjoins the SSSI along 1,075 metres and lies wholly within its Impact Risk Zone. Allocation is the decision that commits the land, and "allocate now, assess later" reverses the order the Habitats Regulations, section 28G and NPPF paragraph 193 require.
The Council's site scoring counts an SSSI only where land lies inside it: Lower Langdon's suitability score of 68.75 is only a flood score, and the SSSI along its boundary was not scored and cost the site assessment nothing. The only site-specific assessment barely shows the SSSI on its constraints map, names it once, sets nothing back from it as required, and leaves Corringham Park Farm out of its constraints analysis.
The Council knows how to protect this SSSI when it chooses. In 2026 it proposed to sell a small parcel of its own land that sits inside the Corringham Park Farm area, next to Langdon Hills Country Park. There was public uproar, and the Council's own Country Parks team "formally raised concerns regarding the relationship between the land, Langdon Hills Country Park, the Langdon Hills Ridge SSSI and the Higher Level Stewardship arrangements". On 13 August 2026 the Council backed down and took "the woodland and SSSI" out of the sale. Its statement of 18 September 2026 [93] cites "environmental constraints" and "due diligence", and says that "the land associated with Langdon Hills Country Park and the SSSI ... will remain in Council ownership". Thirteen days after that decision, the same Council allocated 5,000 homes on the privately owned land around its own parcel. That land shares 1,075 metres of boundary with the same SSSI, and there is no equivalent due diligence for it anywhere in the evidence base.
Fails: legal compliance (Wildlife and Countryside Act 1981 section 28G; NERC Act 2006 section 40), justified, consistent with national policy (NPPF paragraph 193). (Sections 3.4, 4.1, 4.6)
-
The flood evidence says the land should stay floodplain, and is an unapproved draft. Level 2 Strategic Flood Risk Assessment (SFRA) [34] (AECOM, February 2026), site 60940: "Development is not permitted in Flood Zone 3b. This area should be retained as floodplain. Detailed modelling should be undertaken". Stamp: "NOT YET APPROVED FOR ISSUE".
No modelling has been done. The Environment Agency's map [91] puts 16 per cent of the site (about 36 hectares) in Flood Zones 2 and 3 and a Main River, Horndon Brook, through it for 0.98 km.
Flood Zone 3 covers 10.7 per cent of Lower Langdon (about 24 hectares) and Flood Zone 2 a further 5.3 per cent, and the Environment Agency's climate change extent 16.8 per cent (about 38 hectares). The capacity study does leave Flood Zones 2 and 3 out of its developable land, with 10 and 15 metre setbacks, so the 5,000 homes are not drawn on the mapped floodplain. But no document says where Flood Zone 3b actually lies. Flood Zone 3b is the functional floodplain, the land the SFRA says must stay floodplain. Finding it needs the modelling the SFRA calls for, and nobody has done that modelling. The drainage ponds the site needs would also have to sit on the same low ground (section 4.6). The IIA appendix then says the land "is not within Flood Zones 2 or 3". Three Council documents, three flood positions, one month.
Because the Council has no flood model, one was built for this representation in EPA SWMM 5 and HEC-RAS 7, the software the Environment Agency and the drainage industry use, from the Agency's own terrain and flood data and design rainfall, and the drainage the site needs was sized against the national standard. With that land and the Council's other constraints drawn on the site, about 2,126 homes fit on the land, and on the Council's own viability figures no affordable housing is viable (section 4.4; Appendix I, Appendix J and Appendix O).
Fails: justified, consistent with national policy (NPPF paragraphs 170 to 179). (Section 4.6)
-
The homes are not needed. The Government's requirement, the standard method minimum that national policy obliges the plan to meet, is 21,480 (plan, paragraph 4.2.2). The Council's chosen requirement is however 28,880, 34 per cent above it, on a jobs scenario its own consultant says "would not be necessary" for baseline growth and the Council "may" adopt "if it chooses" (Housing Needs Assessment, HNA [41] 4.9, 4.20).
Beyond this, the plan identifies land for 35,906 homes, which is 14,426 homes, 67 per cent, above the Government minimum. Supply within the plan period on the plan's own Table 2 (Regulation 19 Local Plan [1], Table 2, Housing Requirement and Provision to 2044, page 43) is 25,406. The other 10,500 fall after 2044, and 1,600 of those are SS18's. The plan's own trajectory puts 3,400 of SS18's 5,000 homes inside the period and 1,600 after the plan ends, yet on the promoter's own statement the first of them cannot come before about 2033. The Council's own housing land study (HLAA) found land suitable for 50,128 homes across the borough, more than twice the Government minimum.
Without SS18, in-period supply is 22,006, which is above the Government minimum. Thurrock has only built more than 1,000 homes in a year once since 2001 (1,080 net, 2004-05), and its best ten years averaged 567 a year. The plan needs 1,444 a year for twenty years, 2.5 times the best rate the Council has ever achieved, and 1,600 to 1,700 a year from 2029.
The plan gives no reason why house builders in this borough would build at two and a half times the best rate ever achieved here. Its trajectory simply assumes it from 2029, with no mechanism named, while its own viability consultants record that discussions with the site's promoters have stalled. In absolute terms, sixteen councils in England have sustained 1,444 homes a year for twenty years since 2001, nine of them outside London.
Relative to its size, the rate the plan requires is 2.04 per cent growth in the borough's housing stock a year. On the Government's own statistics only two councils in England, Tower Hamlets and South Derbyshire, have sustained that rate over any twenty years since 2001, and no council in Essex has ever built 1,444 homes in a single year. Between 2015 and 2024 the borough added about 15,000 jobs and 5,101 net additional homes. In other words, in Thurrock jobs grew at the rate the twenty-year plan assumes, but with only about two fifths of the homes the plan now says that growth needs.
On the Council's own data, then, jobs and housing demand do not move in proportion with each other. People commute, and the ten years in which 2.9 jobs arrived for every new home contradict the housing study's assumption of 1.08 jobs a home (section 4.5; Appendix G). The Council ignored its own housing and employment data.
The one Freeport site that is already built, London Gateway, supports one job per 248 square metres on its owner's own figures (DP World [111]). The Council's forecast however assumes one job per 73.5 square metres (Economic Development Needs Assessment, EDNA [42], applying the 2015 Employment Density Guide). So for the same floorspace the Council's forecast counts about 3.4 times the jobs the borough's own largest Freeport site actually supports. Moreover, because the Council converts those jobs into homes, the housing figure built on the "higher growth" scenario is inflated by the same logic (section 4.5; Appendix G).
The Freeport tax reliefs that underpin the forecast end on 30 September 2031, before SS18 delivers more than a few hundred homes. In fact before it delivers any: on the promoter's own statement to the Council's consultants, nothing comes in the first five years, so nothing before about 2033 if the plan is adopted in 2028.
Fails: positively prepared, justified. (Section 4.5)
-
The plan will be in deficit on adoption, and SS18 does nothing about it. In the first five years of the plan period (2024 to 2029), the plan's own trajectory delivers 1,457 homes against the 7,220 required, and SS18 contributes none of them. Counted instead as five years from adoption in 2028, the trajectory includes 600 SS18 homes, but the promoter told the Council's consultants that the site cannot contribute "in the first 5 years of the plan", which removes those as well. The result is about one year's supply on adoption against the Council's own figure.
Basildon Borough Council was placed under Government direction in July 2026. The Minister's reasons included that it could show deliverable housing sites for only 1.96 years against the five years' supply national policy requires, and that its Housing Delivery Test result was 35 per cent, meaning it had built about a third of the homes required [95]. An allocated site that fails to deliver does not sit idle. It is taken forward on appeal, on the developer's terms, with the Council's own viability study in hand to cut the affordable housing and infrastructure. SS18 is a significant risk to the plan's delivery assessment at year five.
SS18 makes this worse twice over. It is not needed, yet it is part of the case for the 28,880 requirement against which the Council's five-year supply and Housing Delivery Test will be measured, so it raises the bar. It then delivers nothing towards clearing it. The plan therefore builds in, before it is even adopted, a known and unmitigated risk of a large shortfall against its own target, with the consequences national policy attaches to that: the presumption in favour of development on sites of the developers' choosing, and the loss of the Council's control over where the borough's homes go.
-
No evidence that the Council worked jointly with any service provider or statutory body. No statement of common ground with Basildon (which objected at Regulation 18), Essex County Council (whose roads carry the traffic north), Natural England, the Environment Agency (operating authority for the Main River), the NHS trust, c2c or Network Rail.
Basildon's own plan is being directed to provide about 28,000 homes. The cumulative effect of two new towns and Basildon's Green Belt sites on the same roads, hospital and SSSI has not been assessed by either authority (Section 5.5). The only neighbour to welcome Lower Langdon at Regulation 18 was Southend, as a place for Southend's own unmet need. The plan claims to meet no one else's need.
-
What Cabinet was told does not match the evidence. "A substantial programme of evidence gathering has been completed", "carefully assessed locations", "the total supply is over 30,000", "commitments from developers" and "the government cannot change this plan" (Cabinet report [4] and printed minutes [6], 26 August 2026). Each statement is set against the Council's own evidence in section 4.7.
Members were also told that the plan had benefited from two advisory visits by the Planning Inspectorate. Both visits took place in 2025, before any of the SS18 evidence existed, so the Inspectorate had not seen it. That evidence was published between 12 and 19 August 2026, one to two weeks before the decision on 26 August.
Fails: justified. (Section 4.7)
-
There is no sewer and not enough water. The Council's Water Cycle Study says there is "no existing sewer network" at Lower Langdon and "new infrastructure would be required". None is costed. The only treatment capacity test ever done assessed a different plan-wide strategy, which put 4,000 homes at Lower Langdon and none at Corringham Park Farm. The detailed study it said was needed was never produced. Anglian Water reports room at the works for more treated sewage, but confirms that no capacity check has been made for the site or the sewers that would serve it (12 October 2026).
SS18's 12,000 people are about 44 per cent of all the population growth Anglian Water has planned for the Tilbury catchment to 2050, at a works whose inlet overflow already spills because the sewers lack capacity. Essex & Suffolk Water planned for 19,460 homes in Thurrock over 20 years. The plan delivers 25,406 in its period, 5,946 more, with a further 10,500 to come after 2044, and SS18 is 57 per cent of the in-period excess, in a supply area the water company says is in deficit from 2025 (35.5 million litres a day short in 2029/30), with 16.99 million litres a day of planned surplus for the whole of Essex. The Council told the water company in 2023 that its growth figures were "very conservative" and its demand assumptions "overly optimistic". The water company kept them, and the Council's IDP now relies on them.
Policy DMP03 (page 304) requires every new home to be designed to use no more than 95 litres a person a day. The water company's customers use 150 today and its own target is 118 by 2040. The plan's monitoring framework (the plan's Appendix 1, page 407) checks for 110, not 95. No document in the evidence base says how the occupants of 5,000 homes will use 37 per cent less water than the borough does now, or where that has been achieved.
Result against the tests. Three of the fifteen findings go to legal compliance (1, 2, 9). On soundness, the allocation is not justified on nine (2, 3, 4, 5, 9, 10, 11, 14, 15), not effective on seven (5, 6, 7, 8, 12, 13, 15), not consistent with national policy on four (3, 8, 9, 10) and not positively prepared on two (11, 13). Every finding fails at least one test. Nine fail two or more.
The plan without Policy SS18. In-period supply 22,006 against a minimum of 21,480. The Council's 28,880 requirement is not met within the period with SS18 (25,406) or without it. That shortfall exists already and section 8 sets out the two ways to deal with it. The plan without SS18 is the plan the Council's own appraisal preferred.
Deleting it leaves the plan better on every measure the Council itself uses. It removes the only one of the nine strategic allocations that fails every column of the Council's own consultants' findings (Appendix M), so the site selection reads as the Council's method says it should.
Deleting it removes more than £256.6 million of infrastructure that has no funder and no provider's confirmation, on a bill the Council's own documents show to be incomplete, from a plan that cannot say who pays for what it already contains.
It keeps about 250 hectares of Green Belt the Council's consultant found to perform strongly and recommended against releasing.
It removes the only allocation drawn against the Langdon Ridge SSSI boundary, and with it the Habitats Regulations question the HRA never assessed and the recreational pressure Natural England already records on the SSSI.
It stops a site its own promoter says will not deliver in the first five years from being counted towards supply.
And it lowers the bar the Council will be judged against in the Housing Delivery Test and the five-year supply, a bar set at a rate no council in Essex has ever reached, so the plan is less likely to fail on delivery and hand the borough's sites to appeal. The plan without SS18 is the plan with the fewest ways to fail.
The full schedule of 162 defects, each with the test it engages and its consequence at Examination (that is, what the Inspector would have to do about it), is at Appendix F.
1. Who is making this representation
My name is Dr Jackie Lighten and I live on Old Hill Avenue, Langdon Hills. My home adjoins the allocation, and Old Hill Avenue and South Avenue form part of the northern access the IDP [30] proposes. I have known and walked the SS18 land and Langdon Ridge SSSI for 30 years.
I hold a PhD in evolutionary ecology and have studied and worked at the Universities of Southampton, East Anglia and Exeter, Imperial College London and Dalhousie University. I was a Biotechnology and Biological Sciences Research Council (BBSRC) Future Leader Fellow.
I led the scientific opposition to the Australian Government's proposal to release a herpesvirus (koi herpesvirus) into its waterways to eradicate feral common carp, and gave evidence to the Australian Senate. The opposition was successful. I have worked in highly regulated human medicine manufacture. I am co-founder of a deep tech AI company, which develops edge-based artificial intelligence systems for environmental monitoring. I make this representation on behalf of Protect Langdon, the residents' group of which I am the governing member, and as a resident whose property adjoins the allocation, and not on behalf of my company.
The species evidence in this representation draws on records made on and beside the site by me and other residents over many years. It also draws on Natural England's own citation and supporting information for the Langdon Ridge SSSI [21] [23], which record the species for which the ridge was notified, and on the account by Dr Rodney Cole, former Records Officer of the Basildon Natural History Society, who documented the flora and fauna of the ridge and its surroundings in the submissions that led to the SSSI notification [139]. The records can be corroborated by other local residents and by the appropriate groups on request. No locations are given for badger setts, bat roosts or rare plants.
The Council has carried out no ecological survey on the SS18 development parcels and has provided no evidence of any habitat assessment. If Policy SS18 is kept in the plan I will deploy a 12 to 14 month ecological survey of the site and its SSSI boundary, using passive acoustic monitoring, camera traps and repeated transects, to pre-registered protocol standards, and the survey will run for its full term. Its purpose is to establish the baseline the Council has not collected, to a standard of evidence that no developer's survey will match, so that the biological importance of the land is demonstrated rather than undermined by inadequate surveys conducted by parties in favour of development.
The survey will not be complete by the Examination. I will produce its results, with the protocol, the raw recordings and the validation of every identification relied on, at any court hearing and at any planning appeal concerning this land.
2. The modifications sought
Each modification below is needed to make the plan sound once Policy SS18 is deleted. Proposed wording is given where the plan's text must change.
MM1. Delete Policy SS18 and its supporting text. Delete Policy SS18 in full, with its vision, explanation and requirements (plan pages 288 to 296: the vision, key diagram, policy and explanation).
MM2. Policies Map [2]: return both parcels to the Green Belt. Delete the SS18 allocation (Parcels a and b) from the Policies Map. The land remains in the Green Belt on its existing boundary. It is not to be shown as safeguarded land or as land reserved for development after the plan period. Reason: the Council's Stage 2 Green Belt Assessment [12] finds sub-area CS-01 "Provisional Grey Belt: No", with a strong contribution to preventing neighbouring towns merging. Designating the land as safeguarded would contradict the Council's own evidence and signal its release at the next review.
MM3. Table 1 (Settlement Hierarchy), page 33. Delete the Tier 2 entry "Land North of the A13 (Lower Langdon and Corringham Park Farm) (when established): approximately 5,000 homes; approximately 20 hectares of employment land; new mixed-use district centre."
MM4. Paragraph 4.2.3 and Table 2, page 43. Remove the 3,400 homes from SS18 within the plan period and the 1,600 after it. Restate total supply within the plan period as 22,006 and supply beyond the plan period as 8,900 (10,500 less 1,600). Under MM8 option A the requirement and buffer in paragraph 4.2.3 follow the restated figure. Under option B they are unchanged.
MM5. Appendix 2 (Local Plan Housing Trajectory), page 415. Delete the SS18 row: 0 / 600 / 1,300 / 1,500 / 1,600, total 5,000.
MM6. Consequential references elsewhere in the plan. Remove the references to the new settlement north of the A13 from: the Vision (page 28). Policy SP01, criterion c, "Create new sustainable settlements at West Horndon and on Land North of the A13 near Stanford-le-Hope" (page 32). Policy SP03, criterion 1d and criterion 2(iv), and paragraph 4.2.16 (pages 37 and 38). Policy SP04, District Centres and part B, Provision of New Centres (pages 40 and 41). Plan section 5.6, paragraphs 5.6.1, 5.6.3, 5.6.4, 5.6.10, 5.6.11, 5.6.19, 5.6.20 and 5.6.25 (pages 276 to 280), so that they refer to West Horndon New Town only. The contents (page 7). Correct the reference in Policy SP04 to "Policy SS18 – West Horndon New Town" (page 40), which should read Policy SS17.
MM7. Policy DMP11, criterion 4. Delete "SS18" from the list of strategic sites required to provide serviced Gypsy and Traveller pitches. The 20 serviced pitches Policy SS18 was to provide are to be identified elsewhere through the Gypsy and Traveller Accommodation Assessment [40].
MM8. The housing requirement. I ask for option A. If the Inspector prefers to keep 28,880, option B.
• Option A. Restate the housing requirement in paragraph 4.2.3 at a level the plan's own trajectory can deliver, with a stepped trajectory as Policy SP05 criterion 10 already requires. The standard method minimum is 21,480. The 28,880 figure is a local choice resting on a jobs scenario the Council's own consultants adjusted by hand (section 4, ground J5).
• Option B. Retain 28,880 and record that the shortfall within the plan period, which exists with SS18 in the plan, will be addressed at the first review from the 50,128 homes of capacity the HLAA [38] identifies. The Council may also seek to bring forward, within the period, homes its trajectory now places after 2044 on sites already allocated (8,900 without SS18, 6,000 of them at West Horndon). That is open to it, but only on evidence of deliverability of the kind the trajectory does not at present contain, and at a build rate the borough has never achieved.
MM9. Infrastructure and monitoring. Remove the Lower Langdon schedule from the IDP [30] and the SS18 indicators from the monitoring framework (the plan's Appendix 1).
Why these modifications make the plan sound. Without SS18 the plan still exceeds the Government's minimum. It no longer depends on an allocation that the HRA [11] has not assessed, that the IIA [8] has not appraised, that the Council's consultants advised against, and that its promoter says will deliver nothing in the first five years. Deletion is the only remedy consistent with the Council's own evidence. Any addendum to the HRA or IIA written to cure the defects would have to report what the Council's consultants have already found (section 8).
The defects in SS18 are not confined to SS18. An allocation the Habitats Regulations Assessment never assessed is a legal defect in the plan as a whole, of the kind that stops a plan at examination or in the High Court. An allocation that cannot deliver is a shortfall in the five-year supply and the Housing Delivery Test that every other site in the borough will be judged against. Deleting SS18 removes the one allocation that puts the rest of the plan at risk, and leaves a plan the Council can defend.
3. Legal compliance
3.0 The legal and policy framework applied in this representation
The tests the Inspector applies are fixed by statute and national policy. This representation uses the following, and nothing else.
-
Planning and Compulsory Purchase Act 2004.
-
Section 19(5): the authority must carry out a sustainability appraisal of the plan and prepare a report of its findings.
-
Section 20(5): the Inspector must determine whether the plan satisfies the requirements of sections 19 and 24(1), regulations under section 17(7) and any regulations under section 36, and whether it is sound.
-
Section 20(7C): the Inspector may recommend main modifications that would make the plan sound and legally compliant.
-
Section 20(2): the authority must not submit the plan unless it thinks it is ready for independent examination.
-
Section 20(6): the right to be heard belongs to those who make representations seeking a change within the consultation period.
-
Section 39: the authority must exercise its plan-making functions with the objective of contributing to the achievement of sustainable development.
-
-
Town and Country Planning (Local Planning) (England) Regulations 2012.
-
Regulation 19: publication.
-
Regulation 20: representations.
-
Regulation 22: submission documents, including the sustainability appraisal report and the statement of representations.
-
-
Environmental Assessment of Plans and Programmes Regulations 2004 (the SEA Regulations).
-
Regulation 12(2) and (3) and Schedule 2: the environmental report must identify, describe and evaluate the likely significant effects of the plan and of reasonable alternatives, include the information reasonably required having regard to current knowledge and methods of assessment, and give an outline of the reasons for selecting the alternatives dealt with.
-
Regulation 13: consultation on the report.
-
-
Conservation of Habitats and Species Regulations 2017.
-
Regulation 105: appropriate assessment of a land use plan likely to have a significant effect on a European site, alone or in combination, before the plan is given effect.
-
Regulation 105(2): the authority must consult the appropriate nature conservation body.
-
Regulation 105(4): the authority may give effect to the plan only after ascertaining that it will not adversely affect the integrity of the site.
-
-
Wildlife and Countryside Act 1981, section 28G.
-
Every public authority, in exercising any function likely to affect a SSSI's notified features, must take reasonable steps consistent with the proper exercise of that function to further the conservation and enhancement of those features.
-
-
Natural Environment and Rural Communities Act 2006, sections 40 and 41 (as amended by section 102 of the Environment Act 2021).
-
Section 40: the biodiversity duty on public authorities.
-
Section 41: the list of species and habitats of principal importance.
-
-
National Planning Policy Framework, December 2024 (as amended February 2025).
-
Paragraph 36 sets the four tests of soundness.
-
This is the Framework the plan is examined against (NPPF August 2026 [75], Annex A paragraph 8).
-
The August 2026 Framework's national decision-making policies (in force since 17 August 2026) are cited only for what they mean for the deliverability of an allocation.
-
• Case law.
-
Heard v Broadland DC [2012] EWHC 344 (Admin) and Save Historic Newmarket v Forest Heath DC [2011] EWHC 606 (Admin): reasonable alternatives.
-
Cogent Land LLP v Rochford DC [2012] EWHC 2542 (Admin): curing an appraisal defect.
-
Calverton PC v Nottingham CC [2015] EWHC 1078 (Admin): exceptional circumstances.
-
Compton PC v Guildford BC [2019] EWHC 3242 (Admin): the authority's judgement.
-
People Over Wind (C-323/17) and Holohan (C-461/17): the content of an appropriate assessment.
-
Wealden DC v SSCLG [2017] EWHC 351 (Admin): in-combination assessment.
• Guidance.
-
Planning Inspectorate, Procedure Guide for Local Plan Examinations [77] (legacy system), 11th edition, July 2026.
-
Planning Practice Guidance [76]: Green Belt, February 2025, and Housing supply and delivery.
-
Ministers' letters to the Planning Inspectorate of 30 July 2024, 8 October 2025, 27 November 2025 and 15 July 2026.
The statutory duty to cooperate (section 33A) ceased to apply on 25 March 2026 and is not relied on. Cooperation is addressed as a soundness matter under NPPF paragraphs 24 to 27 (section 5.5).
The plan is not legally compliant in respect of Policy SS18 on three grounds. The first two are each sufficient on their own. The third is two statutory duties on the Council itself that the evidence base leaves unaddressed. One further defect supports the second ground. A point on consultation is recorded as context and is not relied on as a legal ground.
In order, they are as follows:
Ground L1: the Habitats Regulations Assessment does not assess the SS18 allocation (section 3.1).
Ground L2: the sustainability appraisal never appraised the strategy the plan adopts (section 3.2).
The supporting defect to ground L2: the IIA reaches opposite conclusions about the same land (section 3.3).
Ground L3: the two duties, section 28G of the Wildlife and Countryside Act 1981 and the biodiversity duty in the NERC Act 2006 (section 3.4). The consultation point is at section 3.5.
3.1 Ground L1: the Habitats Regulations Assessment does not assess the SS18 allocation
The legal requirement. Regulation 105 of the Conservation of Habitats and Species Regulations 2017 requires a plan-making authority, before giving effect to a land use plan likely to have a significant effect on a European site, to make an appropriate assessment of the implications for that site in view of its conservation objectives. The authority may give effect to the plan only after ascertaining that it will not adversely affect the integrity of the site. The standard is precautionary: the burden is on the authority to demonstrate no adverse effect, not on objectors to demonstrate harm.
The Council's documentary evidence. The Council's Habitats Regulations Assessment (HRA) [11] was prepared by LUC and finalised on 31 July 2026. Its opening paragraph states that it was prepared "in relation to the Regulation 19 Consultation Draft of the Thurrock Local Plan (July 2026)". It is 323 numbered pages long.
What it contains. A full text search of the HRA returns no occurrence of "Langdon", "Lower Langdon", "Corringham Park", "Corringham Park Farm" or "north of the A13". The word "Corringham" appears 74 times, every one in connection with other policies (SS08, NS40 to NS44, PP14 and PP15).
The HRA screens strategic allocations numbered SS01 to SS18. Its entry headed "Policy SS18" reads: "Policy SS18 West Horndon New Town ... This policy allocates approximately 463 ha of land south of West Horndon for a residential-led mixed-use new town delivering around 10,000 dwellings" (HRA page 285). In the published plan West Horndon is Policy SS17. The new settlement north of the A13, Policy SS18, does not appear in the HRA under any name or number. In plain terms: no Habitats Regulations Assessment of any kind, desk-based or otherwise, exists for Lower Langdon or Corringham Park Farm. (Full-text search of the HRA, repeated 23 September 2026).
Why the numbering is out. The HRA lists a policy "SS14 Land north-east of South Ockendon". No such policy exists in the published plan. Its removal moved every later policy number down by one, so that the HRA's "SS18" is actually the plan's SS17, and the HRA's list ends one policy short of the settlement north of the A13. The same displacement appears in the summary matrix of the Integrated Impact Assessment [8] (IIA page 497), which contains a row for "SS14 – Land north-east of South Ockendon" and two rows numbered SS15.
The HRA also relies on "Policy DM28 – Open Space, Sports and Leisure" for its recreation conclusions. In the published plan open space is DMP27 and DMP28 is riverside uses. It describes the plan as "the Draft Thurrock Local Plan (Parts 1 and 2)", a structure the published plan does not have. The Council's viability consultants, working separately, costed policies numbered "Strategic Policy 4 – Housing" to "Strategic Policy 7 – Infrastructure", which the published plan numbers SP05 to SP08.
Two consultants in different months were given a plan numbered differently from the one published, and neither report was reconciled to it. [HRA pages 7 to 8, 285; Viability Assessment [29] ES 13, PDF page 10]
The sequence the documents record is this: The plan the consultants were instructed on had eighteen strategic policies and did not include the settlement north of the A13 because, in the Council's preliminary work, its preferred strategy "did not take forward Lower Langdon". The IIA says Lower Langdon had been left out because West Horndon was "the stronger strategic option" and was brought back "because of the increased housing requirement being tested".
The South Ockendon site was then dropped, after the HRA, the IIA's matrix and the Heritage Impact Assessment had been drafted. Every policy after it was renumbered one lower. The reinstated Lower Langdon took the SS18 number that West Horndon had carried, so that the HRA's "SS18" and the plan's SS18 are different places. The Council has not explained any step of this. Whatever the explanation, an allocation added after the assessments were written has not been assessed.
The HRA nevertheless assesses the full housing total. The HRA applies the plan's requirement of 28,880 homes and the growth that goes with it, while omitting the 5,000-home allocation that contributes to that total.
Its appropriate assessment concludes that adverse effects on the integrity of the Thames Estuary and Marshes Special Protection Area (SPA) and Ramsar site cannot be ruled out on three pathways: physical damage and loss of functionally linked land, non-physical disturbance and, in combination with the Lower Thames Crossing, air pollution. It reached those conclusions without considering 250 hectares of open arable land inside the estuary's zone of influence.
The plan's own policies require the assessment that was not done. Policy DMP23 (plan page 330) provides: "All residential developments with a net increase in dwellings, located within the Zone of Influence (ZOI)(see Policies Map), 8.1km of the Thames Estuary Marshes Special Protection Areas (SPA) and Ramsar sites will be subject to screening and appropriate assessment under the Habitats Regulations".
Policy SS18 (plan page 292) confirms the site is within that zone: it requires new parkland "to account for extra recreational pressure on the Ramsar/SPA Thames Estuary and Marshes, and Langdon Ridge SSSI". The plan's development management policy requires screening of every residential development in the zone. The plan's allocation policy places this site in the zone. The plan's HRA never screened it.
The gap is wider than the HRA. No document in the evidence base assesses the effect of 5,000 homes on the notified features of Langdon Ridge SSSI, which the HRA does not cover because a SSSI is not a European site (sections 3.4 and 4.6). And the "new parkland" the policy relies on to absorb the recreational pressure it acknowledges has no area, location, cost or delivery body anywhere in the plan or the Infrastructure Delivery Plan (section 4.4): the policy's own mitigation is a label, not a measure.
Functionally linked land. The HRA sets a zone of influence of 8.1 km for the Thames Estuary and Marshes and states (section 6.17): "Wintering, migratory and breeding bird surveys are required for sites with high and moderate suitability to support these qualifying species to determine their individual and cumulative importance for these species and inform mitigation proposals." Its criteria for suitability are openness, size, shape, absence of tall boundary features, absence of existing disturbance, connectivity along flight lines and flood zone position.
Its species table records that dunlin "may roost in fields close to salt marshes and estuaries", that ringed plover and hen harrier "may utilise arable and pasture", and that black-tailed godwit, avocet and redshank "may utilise grassland close to wetlands".
Lower Langdon is 225 hectares of open arable land and grassland inside the zone of influence, containing land in Flood Zones 2 and 3. It meets each of the HRA's own criteria for a site requiring survey. It was never rated and no survey was required, because it is not in the plan the consultants were given. I personally have recorded golden plover, lapwing and curlew on these fields, and flocks of wildfowl moving between the estuary and the land, over many winters (Appendix D). Those are three of the species the HRA itself identifies as raising the functionally linked land question. The same appendix records, on and beside the site, species that are not linked to the marshes at all and that no assessment reaches: adder, brown hare, bats, badger, lesser spotted woodpecker and other section 41 species of principal importance, which engage the biodiversity duty (section 3.4) rather than the Habitats Regulations. [HRA paragraphs 5.10, 6.12, 6.15 to 6.17]
The HRA has not cleared the plan even for the sites it examined. Its executive summary states: "Until such time as the Local Plan is updated to reflect the recommended mitigation measures and the AADT [annual average daily traffic] traffic modelling data is provided, a conclusion of no adverse effect on integrity cannot be reached." The plan was published for Regulation 19 with an unresolved conclusion for the seventeen allocations the HRA covers and no assessment of this one.
The SANG is not in the HRA. Policy SS18's only mitigation for recreational pressure on Langdon Ridge SSSI and the estuary sites is a Suitable Alternative Natural Greenspace (SANG). The HRA does not mention it. The plan and the Infrastructure Delivery Plan [30] give it no area, location, cost, phasing or delivery body. The IDP's only recorded source for it is an internal officer conversation. The IDP's Recreational disturbance Avoidance and Mitigation Strategy tariff for the site (£638,640 at £122.30 a dwelling) implies 5,222 dwellings, a count used nowhere else in the schedule, is stated at a 2019 base without indexation, and cites the Essex Coast Recreational disturbance Avoidance and Mitigation Strategy (RAMS) "Draft". A mitigation measure on which the plan's conclusion of no adverse effect depends, for a site the assessment never examined, cannot be relied on (People Over Wind, C-323/17: mitigation may not be taken into account at screening; Holohan, C-461/17: the assessment must contain complete, precise and definitive findings).
The SANG is also the measure the Council has not priced. Provided to Natural England's standard of 8 hectares per 1,000 residents, it takes about 27 hectares more land and £7.9 million to £10.4 million for its works and 80 years' management. With the other constraints the Council's own policies impose, 2,126 homes fit, the land is £95 million to £102 million short at the plan's 35 per cent affordable housing, and no affordable housing is viable on any land price test (section 5.2; Appendices I and J). The mitigation the HRA would have to rely on is one the site cannot pay for.
In combination with the Lower Thames Crossing. The HRA's own conclusion on air pollution is that adverse effects in combination with the Lower Thames Crossing cannot be ruled out until traffic data is supplied. A 5,000-home settlement on the A13, generating 1,477 car driver trips in the morning peak on the Council's own forecast, contributes to that in-combination effect and is absent from the calculation (Wealden DC v SSCLG [2017] EWHC 351 (Admin)).
The traffic data is not missing because it does not exist. The Council's own Transport Assessment [32] forecasts the trips. What the HRA records is that the annual average daily traffic figures its air quality method needs had not been supplied to its authors when it was finalised on 31 July 2026. The evidence base was published between 12 and 19 August 2026 for a decision on 26 August (section 4.7). The transport, habitats and viability reports were finished in the same weeks by different consultants, and none was reconciled to the others. After years of plan-making, the assessment that the law requires before the plan is given effect was left waiting on a spreadsheet.
A second, independent defect: the water-quality conclusion rests on the wrong water company. The HRA screens the plan in for likely significant effects on the Thames Estuary and Marshes SPA and Ramsar site through water quality (paragraph 6.77, PDF page 122) and names the pathway correctly: "Increased volumes of treated wastewater discharges, resulting in nutrient enrichment of water and potential lowering of dissolved oxygen ... downstream of Water Recycling Centre (WRC) outfalls" and "Overloading of the combined sewer network during storm events" (6.79, PDF pages 122 to 123). The plan then relies on mitigation from a water company that serves none of the plan area: "Southern Water detail the following mitigation measures", including "264 combined sewer overflows in the Medway catchment", "Upgrades to Motney Hill wastewater Treatment Works", "Medway WTW Indirect Potable Water Recycling", "South East Water bulk supply near Canterbury" and "West Sandwich and Sandwich WSW licence variation" (6.80, PDF page 123), and Southern Water's "Drainage and Wastewater Management Plan (DWMP) for Gravesend" (6.81, PDF page 124; reference 44).
Its conclusion: "providing that the mitigation measures and improvements set out by Southern Water are followed and policy protection measures are implemented and delivered successfully, the Local Plan will not result in adverse effects on the integrity of the Habitats Sites as a result of changes in water quality, either alone or in-combination" (PDF page 125). The non-technical summary repeats that mitigation "will be provided through the Drainage and Wastewater Management Plan" (PDF pages 7 to 8).
Southern Water is the sewerage undertaker for Kent. Thurrock's is Anglian Water: "AW manage wastewater assets within the Thurrock area", and Tilbury WRC "serves the majority of the urban areas of Thurrock", discharging to the tidal Thames (Water Cycle Study, WCS [43] 5.4 and 5.4.1, PDF pages 22 to 23). The Council's own Water Cycle Study says "the volume and quality of discharge from Tilbury WRC still needs to be considered, particularly in relation to the connected water dependent habitats", which it lists as the Thames Estuary and Marshes SPA and Mucking Flats and Marshes SSSI (WCS 6.1 and Table 4-2).
Across the whole HRA "Anglian" occurs 0 times, "Upminster" 0 times, and Tilbury WRC is never named. The HRA assessed no works that would receive the plan's sewage.
Nor has the sewerage undertaker confirmed that SS18 can be served.
Anglian Water responded at Regulation 18 as a duty to cooperate body, in six borough-wide and settlement comments on the 2023 Initial Proposals, in which Lower Langdon appeared only as a "New Place Opportunity Area". Nothing in the Regulation 19 plan, the Infrastructure Delivery Plan, the Water Cycle Study scoping report or the HRA records any consultation of the sewerage undertaker on 5,000 homes at SS18, any confirmation of capacity at the receiving works, or any statement of common ground.
For a site with no sewer, in a catchment whose works already overflows for lack of capacity, that is not an oversight the plan can carry. Anglian Water's reply to my information request (12 October 2026; Appendix E8) [149] confirms the position. It supplied data to the Council's consultants for a detailed Water Cycle Study that has not been published, and attended two general meetings of which no notes exist. It has made no capacity check, pre-development assessment or connection assessment for the site, and cannot yet say whether it will find the plan sound. It reports room at Tilbury for more treated sewage, so the question is not how much the works can treat. It is whether the sewers can carry SS18's sewage there without adding to the spills recorded below, and nobody has assessed that.
What the regulator's own data show at that works. The Environment Agency's storm overflow returns [115] record that the inlet overflow at Tilbury WRC spilled 44 times from April to December 2023, 56 times in 2024 and 64 times in 2025, for 96, 162 and 142 hours: rising each year, while spills across England fell by about 35 per cent in 2025.
Sixty-four spills is more than five times Anglian Water's 2025 average of 12.0 per overflow. Only 32 of its 1,438 monitored overflows spilled more. Anglian Water's own stated reason, single-year and long-term, is "Not asset maintenance - Hydraulic capacity", which the Environment Agency's dataset guide defines as "insufficient capacity (conveyance or storage) in the sewer network to cope with the wastewater flow plus typical rainfall entering the sewer network".
The 2025 return records "No improvement action in reporting period". The works' permit, varied on 10 December 2025, keeps its dry weather flow at 40,000 cubic metres a day, lower than the 42,514 permitted from 2010 to 2016, and sets no limit on total nitrogen or phosphorus, the nutrients the HRA names as the harm pathway (5.76 to 5.77) [114]. The outfall is 2.1 km from the Ramsar site and 2.5 km from the SPA in a straight line, and two network overflows in the Stanford-le-Hope and East Tilbury area discharge within 0.9 km of both [Appendix K]. The 2025 returns, with the "Hydraulic capacity" reason, were published in March 2026, four months before the HRA was finalised.
The question is not only whether the works can treat more sewage, but whether the network can carry it there without more spills. The only treatment capacity test the Council has made (section 4.6, WCS Table 6-1) found Tilbury WRC's residual headroom under the growth option it tested, which had 4,000 homes at Lower Langdon, falling to 485 homes at today's water use. The sewer network feeding the works already spills for lack of capacity. Anglian Water reports room at the works for more treated sewage (12 October 2026), but has assessed neither the network nor a connection for SS18.
Why the second defect matters. The first defect is that the HRA never assessed SS18. The second, set out above, is that its water-quality conclusion for the whole plan rests on Southern Water's measures in Kent rather than Anglian Water's works at Tilbury. Mitigation relied on at appropriate assessment must be certain and effective when the assessment is made (People Over Wind [104]; Holohan [105]).
Mitigation belonging to another undertaker, serving another catchment on the other side of the estuary, has no connection to the pathway the HRA identified. For Tilbury there is no mitigation at all. The policies the conclusion also leans on (DMP28 riverside uses, DMP29 flood risk and drainage, SP06) do not govern treatment capacity or discharge quality. The water-quality conclusion is therefore unsupported for the whole plan.
This defect is independent of the renumbering: an addendum that screened SS18 would still rest on Southern Water's measures. SS18 is directly caught: it has no sewer (WCS 6.1.3), its sewage goes to Tilbury, and its 12,000 people are about 44 per cent of the population growth Anglian Water's Drainage and Wastewater Management Plan provides for in the whole Tilbury catchment to 2050 (153,000 in 2021 to over 180,000; IDP [30] page 75). [Appendix K]
Natural England. Regulation 105(2) requires the authority to consult the appropriate nature conservation body. The HRA itself records that Natural England should be consulted on it. No published record shows that consultation took place.
Natural England's Regulation 18 response (IP0179) stated that this allocation "should not be taken forward until alternative site options have been fully considered. If it is to be taken forward then additional assessment should be undertaken of impacts." No additional assessment of impacts exists. The full response (19 February 2024) specified what was needed: "a suitable visitor survey and habitat assessment to provide a comprehensive baseline", taking account of existing formal and informal access routes into the SSSI and the cumulative impact of Dunton Hills and West Horndon, and added: "Natural England would expect to be consulted on any draft assessment and mitigation proposals." Natural England holds no record of any such assessment or consultation [137] [138]. Natural England's reply to my information request (5 October 2026) [137] confirms the position.
Asked for every version of the plan, policy schedule or HRA supplied to it and for any request for its opinion under regulation 105(2) on the Appropriate Assessment of 31 July 2026, Natural England "holds no additional information other than comments made in our responses to Local Plan consultations". On the HRA it has "no information on this other than what is provided regarding the HRA, in our responses to the Local Plan consultations", and it holds no internal note or advice on SS18 beyond those responses.
The position is therefore this. The Council is a public authority with a statutory duty under section 28G of the Wildlife and Countryside Act 1981 to further the conservation and enhancement of Langdon Ridge SSSI, and it manages part of the SSSI itself.
The statutory body responsible for the SSSI told it in writing, in February 2024, that this site should not be taken forward without a visitor survey, a habitat assessment and a cumulative assessment, and that it expected to be consulted on any assessment and mitigation.
The Council produced none of those things, supplied Natural England with no version of the HRA, made no request for its opinion under regulation 105(2), and published for Regulation 19 an assessment that does not mention the site. The same Natural England has, since 2024, required a cumulative impact assessment for 375 homes at Laindon, required a financial contribution and visitor management for 2,100 homes at West Horndon, 2.5 km away, which it said would otherwise "damage or destroy the interest features" of the SSSI, advised that for 300 homes at Vange the SSSI "may be at capacity", and recorded from its own officers that recreational pressure is "currently an issue" there, causing trampling, dog-worrying of livestock and litter (section 4.6). It has given that advice on every housing scheme near the SSSI except the largest (SS18), which lies on the SSSI's own boundary, puts a bus road onto a lane whose verge is the SSSI, and sends its traffic and its 12,000 people onto the land between the SSSI's units whose "linkage and the avoidance of isolation" Natural England's own supporting information names as what the SSSI depends on. On this allocation Natural England was not consulted. The record contains no request.
The required work has not been done, the statutory consultee was left out of the process, and the plan was sent to publication regardless. That is the omission the Inspector is asked to find at section 3.6, and it is one on which Natural England's own Regulation 19 response will be material.
The test engaged. Legal compliance. An Inspector can weigh harm against benefit. An Inspector cannot weigh an assessment that does not exist. The correct statement is not that homes were unscreened, since there are no homes to screen. It is that the HRA accompanying this plan does not assess the allocation of approximately 250 hectares north of the A13 for development.
The Council's likely reply, and the answer. The Council will say the omission is clerical, that the HRA's conclusions apply to the plan as a whole, and that an addendum can be produced.
The answer is in three parts. The HRA's conclusions are expressly site-by-site: it screens each allocation, rates each for functionally linked land and requires surveys of the sites that qualify. A conclusion reached on seventeen sites does not extend to an eighteenth that was never examined. An addendum is possible, but Natural England must be consulted on it and, if it changes the plan, so must the public (Procedure Guide for Local Plan Examinations [77], 11th edition, paragraphs 1.4 and 9.3). It cannot be done before submission in December, and done properly it would have to assess the functionally linked land question on 225 hectares of open arable land with no survey data, against a Natural England position that already opposes the allocation. That is a cure that produces the evidence for deletion (section 8). And the Cabinet was told (Cabinet report [4], 26 August 2026, paragraph 4.19) that the plan and evidence had been reviewed by King's Counsel to ensure the process was "sound and legally compliant". An HRA that omits a 5,000-home allocation, states that no conclusion can be reached, and rests its water-quality conclusion on another water company's works in another county is hard to reconcile with that assurance.
On the second defect the Council will say that an HRA addendum can substitute Anglian Water's plans for Southern Water's. The answer is that Anglian Water's own return attributes the Tilbury overflow to lack of hydraulic capacity, records no improvement action, and sets no nutrient limit. An addendum that assessed Tilbury would have to model the works with and without SS18, and could not rely on a Drainage and Wastewater Management Plan whose medium-term strategy for Tilbury to 2035 is to "increase attenuation" (WCS 5.4).
3.2 Ground L2: the sustainability appraisal never appraised the strategy the plan adopts
The legal requirement. Section 19(5) of the Planning and Compulsory Purchase Act 2004 requires a sustainability appraisal of the plan.
The Environmental Assessment of Plans and Programmes Regulations 2004 (the SEA Regulations), regulation 12 and Schedule 2 paragraph 8, require the environmental report to identify, describe and evaluate the likely significant effects of the plan and of "reasonable alternatives", and to give "an outline of the reasons for selecting the alternatives dealt with". The courts require the chosen strategy and the reasonable alternatives to be assessed on a comparable basis and the reasons for the choice to be stated (Heard v Broadland District Council [2012] EWHC 344 (Admin); Save Historic Newmarket Ltd v Forest Heath District Council [2011] EWHC 606 (Admin)).
What the IIA appraised. The Integrated Impact Assessment (IIA, July 2026) [8] appraised six spatial options from 2023, a seventh "hybrid" option, and nine sub-options of the hybrid (Table 2.2, page 53). Spatial Option 7 has no new settlement at Lower Langdon. Of the nine sub-options, eight have Lower Langdon at zero. The ninth, HG2, pairs West Horndon at 5,000 homes with Lower Langdon at 3,941.
No appraised option pairs West Horndon at 10,000 with Lower Langdon at 5,000, which is the strategy the plan adopts. Corringham Park Farm, the 1,000-home first phase, appears in no option at any figure (IIA Table 2.1, page 43; Table 2.2, page 53). The housing strategy the plan adopts has therefore never been scored.
The one version of this allocation the IIA did score, a smaller Lower Langdon with no Corringham Park Farm, dragged the performance of the whole strategy down: HG2 scored worse than the all-West Horndon option on eight objectives and better on none. The Council's response was not to drop it but to enlarge it, to 5,000 homes across both parcels, and to adopt the enlarged version without appraising it at all.
Nothing in the IIA's own objectives suggests a larger allocation in the same place, on more of the same floodplain and against the same SSSI, would score better than the smaller one that lost, and every one of them suggests it would score worse. The Council has not shown otherwise because it never ran the comparison.
The figures in Table 2.2 are these. Every sub-option gives the towns with stations (the IIA groups the borough's towns by whether they have a railway station) 19,905 homes (or 16,854, 18,379 or 14,670 in three variants), the towns without stations 7,203 or 5,084, and the villages 39 to 134. The only variable is the new settlements, that is, the homes at West Horndon and at Lower Langdon. Corringham Park Farm appears in none. HG1: West Horndon 10,000, Lower Langdon nil, total 37,242 homes for the whole borough. HG2: West Horndon 5,000, Lower Langdon 3,941, total 36,183 for the whole borough. Target for both: 36,100. So in the Council's own arithmetic Lower Langdon was never an addition to the strategy. The only sub-option that contains it, HG2, does not add Lower Langdon to a 10,000-home West Horndon: it halves West Horndon to 5,000 and puts 3,941 at Lower Langdon instead, and that swap delivers 1,142 fewer homes than keeping all 10,000 at West Horndon (36,183 against 37,242).
The combination the plan adopts, 10,000 at West Horndon and 5,000 at Lower Langdon, was never put in the table and never scored. The table does not name individual sites, so it does not show whether the 1,559 homes at the South Ockendon site later dropped from the plan sit inside the 19,905 for the towns with stations. The IIA's policy matrix still appraises that site, which confirms the appraisal was made before it was removed (section 3.1). Spatial Option 7, the hybrid the Site Selection Methodology [37] says was used to sift sites, gives this area "Langdon Hills (200)" and nothing else.
The adopted strategy is recorded but not appraised. IIA paragraph 2.68 records that "the preferred distribution directs development towards" West Horndon at approximately 10,000, land north of the A13 at approximately 5,000 and Purfleet at 3,000. That distribution is not among the alternatives appraised. IIA paragraph 2.55 describes the preferred strategy as including "one new town". The Council's Site Selection Methodology (July 2026, section 3.4) says the strategy used to sift sites is "a hybrid of spatial options 1, 2 and 4" and "spatial option 7", the option with no Lower Langdon in it.
In plain terms: the IIA names a preferred distribution that it never measured. None of the nine alternatives it did measure is that distribution. The one version of Lower Langdon it did measure lost. The Council's own sifting of sites was done against a spatial option that has no Lower Langdon in it.
The only reason the record gives for the site's return is "the increased housing requirement being tested" (IIA page 51). The preference for this land follows from the decision to plan for more homes, not from any appraisal finding the land suitable for them, and no such appraisal exists.
The SEA Regulations require the opposite order: the alternatives are appraised, and the reasons for choosing the preferred one are given against that appraisal. Here the choice came first and the appraisal never followed.
The only option containing Lower Langdon scored worse than the option without it. When HG1 (West Horndon alone at 10,000) was compared with HG2 (West Horndon at 5,000 and Lower Langdon at 3,941, with no Corringham Park Farm), HG1 scored better on transport, air quality, climate change, natural resources, water, biodiversity, the historic environment and landscape, and worse on nothing (IIA paragraphs 4.73 to 4.80, pages 136 to 143). The IIA's reasons: Lower Langdon "does not benefit from a nearby railway station and as such is considered to be less sustainable in terms of transport and potential to limit air pollution and carbon emissions", and splitting growth "across two locations" makes service provision and self-containment less likely (paragraph 4.73).
Paragraph 4.80 records that "the Lower Langdon new settlement has the potential to adversely affect the nearby biodiversity sites of Langdon Ridge SSSI (also designated as the Northlands Wood Country Park) and Grove House Wood Local Nature Reserve, as well as a number of nearby listed buildings and landscapes of high sensitivity". The 2023 appraisal had ranked the two-new-towns option fifth of six and the Council had chosen an option without Lower Langdon as "the most sustainable option for growth" (IIA 2023 [50], paragraphs 4.90 to 4.91, page 158).
The Council may answer that a new station at Corringham would cure the transport scoring. Its own Infrastructure Delivery Plan lists "Corringham station" as a "High-level ambition" with delivery "Unknown" (IDP page 38): no scheme, no promoter, no funding, no date and no policy in the plan, and the only mention of it in the Regulation 18 consultation is a developer offering to safeguard land for one.
The IIA scored the site without it, and a station that exists in no programme cannot be used to rescore it. The site's own transport assessment measures its rail access from Stanford-le-Hope station, 0.8 km from the Lower Langdon parcel. A station at Corringham, wherever it was placed, would be no closer for most of the site.
How the site came back. IIA paragraph 2.61 (page 51): the first-stage preferred strategy "did not take forward Lower Langdon. This reflected the conclusion at that stage that West Horndon represented the stronger strategic option." Lower Langdon "was brought back into consideration because of the increased housing requirement being tested" and because "the site promoter demonstrat[ed] that the development could be delivered within a timeframe consistent with the key objectives and infrastructure milestones of the Plan". Neither reason is an environmental criterion.
The promoter's demonstration has never been published.
The sub-options were sized to the high-growth requirement plus a 25 per cent buffer, 36,100 homes (paragraph 2.64). In every sub-option the existing towns receive the same homes whether or not Lower Langdon is included, and Lower Langdon only ever replaces 5,000 at West Horndon. HG1, without it, delivers 37,242 homes against the 36,100 target.
Both of the reasons given for the site's return fail on the Council's own evidence. The first, the higher housing requirement, was a choice, and it is worth being exact about what rose and what fell between the site's rejection and its return.
The Government's minimum went down: the standard method gave Thurrock 1,177 homes a year in April 2022, and after the Government revised the method in December 2024 the Council's own consultant calculated it at 1,071 to 1,077 a year (Housing Needs Assessment 2025, paragraph 3.1 and Table 3.1, page 17), a fall of about 9 per cent. The plan prints the result as 21,480 over the period (paragraph 4.2.2). The only number that went up was the Council's own target, which the plan describes as "an uplift to the Standard Method housing need figure of approximately 34%" (paragraph 4.2.3).
That uplift rests on one assumption: that new jobs in Thurrock need new homes in Thurrock in fixed proportion, at the 1.08 jobs for each home the Housing Needs Assessment converts at. The Council's own data say otherwise: between 2015 and 2024 the borough added about 15,000 jobs and 5,101 homes, about 2.9 jobs for every new home, and the year-by-year record shows no relationship between jobs growth and house building of the kind the assumption requires: the jobs came, and the homes did not follow them, because most of the new jobs are filled by people who travel in.
Applying the Council's own record of the relationship between jobs and homes to its own jobs forecast gives a need of about 10,600 homes over the plan period, not 28,880. The requirement the site was brought back to serve is about 2.7 times what the Council's own data forecast (section 4.5; Appendix G).
The site had not been rejected because the Council was aiming for fewer homes: the Green Belt assessment rejected it for the harm it would do and the housing land study for its position, and neither finding has been revisited. The Council adopted the high-growth target without testing whether it could be delivered or whether the jobs it rests on would produce it, and this representation tests both. The figures are set out in full at section 4.5 and Appendix G, and no council in Essex has ever built homes at the rate the target requires (Appendix H).
The second, the promoter's demonstration of delivery "within a timeframe consistent with" the plan, has never been published, and the same promoter told the Council's viability consultants five months later that the site "was not expected" to contribute "in the first 5 years of the plan", that discussions had "stalled" and that it was "seeking a development partner" (Viability Assessment 8.63 to 8.68). The promoter's position reversed between the site's reinstatement and the plan's publication. The plan did not. A site brought back for two reasons, one untested and one since withdrawn by its own author, has no reason left standing.
The test engaged. Legal compliance (SEA Regulations regulation 12; Planning and Compulsory Purchase Act 2004 (PCPA), section 19(5)). The strategy the plan adopts was chosen after the comparison, appears in none of the compared options, adopts the location the comparison rated worse, and does so without stated environmental reasons. The defect also goes to whether the plan is justified: the Council cannot show that SS18 is "the most appropriate strategy when reasonable alternatives have been considered", because the appraisal that considered the alternatives preferred the strategy without it.
The Council's likely reply, and the answer. The Council may say that the sub-options bracket the adopted strategy and that the IIA's site-level chapter 6 appraises Policy SS18 itself. Chapter 6 appraises the policy in isolation against the objectives. It does not compare the adopted strategy with the strategy without SS18, which is what the Regulations require. The Council's own chapter 4 made that comparison, and the version with Lower Langdon lost. The Council may also say the defect can be cured by an addendum (Cogent Land LLP v Rochford District Council [2012] EWHC 2542 (Admin)). It can, but only by an addendum that scores the adopted strategy against the strategy without Lower Langdon, is consulted on, and is considered with an open mind. The Council's consultants have already scored that comparison and the version without Lower Langdon won on eight objectives. An addendum that does that is evidence for deletion.
There is a further comparison the IIA never made at all. Policy SS18's 5,000 homes sit beside about 2,261 homes the plan allocates at Corringham and 938 at Stanford-le-Hope (Table 1, page 33), on the same roads, the same station, the same hospital and the same SSSI, and across the ridge Basildon is under direction to bring forward its own Green Belt sites on the same side of its borough, while across the A127 Brentwood Borough Council has resolved to grant outline permission for up to 3,700 homes at Dunton Hills Garden Village (application 21/01525/OUT, committee resolution of 29 November 2023). Taken together that is more than 8,000 homes proposed for the land between Stanford-le-Hope, Corringham, Horndon-on-the-Hill and Langdon Hills, enough to join those settlements into one.
No document appraises that combination. The IIA scores each allocation alone against the objectives. The transport assessment models each site's junctions. The HRA, which is the one document obliged to assess effects in combination, does not contain the site. Basildon's sites are in no Thurrock assessment at all (sections 4.6 and 5.5). The effects that matter most here, on the SSSI, the roads, the sewerage and the gap between the towns, are cumulative, and every assessment the Council relies on was drawn in a box smaller than the thing it needed to measure.
3.3 Supporting point to ground L2: the IIA [8] reaches opposite conclusions about the same land
The IIA appraises the same land three times and reaches three different conclusions on flood risk. Its Appendix F, paragraph G.299, records "an uncertain significant negative effect" for flood risk and states that the land "is not within Flood Zones 2 or 3".
Chapter 4, paragraph 4.79, states that Lower Langdon is "affected by fluvial and surface water flood risk" and records "a significant negative effect". Chapter 6, Table 6.32, scores Policy SS18 against the flood risk objective as 0, negligible, on the reasoning at paragraph 6.430 that "the policy sets out that areas of river corridors and higher flood risk on site should be used as an asset to deliver a fully integrated nature-based and SuDS strategy".
No such strategy exists. Policy SS18 requires one to be prepared at masterplan stage, after allocation. The same reversal occurs for the historic environment: "uncertain significant negative" at paragraph 4.80, "uncertain minor negative" at G.301, and 0, negligible, in Table 6.32. The land did not change between chapters. No new flood or heritage evidence was produced between them. The Council's Level 2 Strategic Flood Risk Assessment [34], five months earlier, had recorded for this site that Flood Zone 3b "should be retained as floodplain" and that "Detailed modelling should be undertaken".
That modelling has now been done, though not by the Council. Because no flood model of the site existed, one was built for this representation in EPA SWMM 5 and HEC-RAS 7, the software the Environment Agency and the drainage industry use, from the Agency's own terrain, flood and rainfall data, and the drainage land the site needs was sized against the national standard that the Council's own Policy DMP29 names (Appendix O). It is new evidence, and it changes the land budget: the capacity study allows 6.4 hectares for drainage where 19 to 25 hectares are needed, and once that land and the Council's other constraints are drawn on the site about 2,126 homes fit, not 5,000 (section 4.4; Appendix I).
An environmental report whose site-level scores contradict its own option-level findings, without new evidence, does not "identify, describe and evaluate" the likely significant effects as the SEA Regulations require. (IIA paragraphs 4.79, 4.80, 6.430, G.299, G.301; Table 6.32)
The mechanism is the IIA's own scoring threshold. Table D.11 of the IIA Appendices [9] scores flood risk at policy level as negligible unless more than 25 per cent of the site area is at risk, so a site can contain functional floodplain across a fifth of its area and score 0. The same site appraisal contains other signs that it was not written for this site: paragraph 6.426 scores SS18 significant positive for health while noting the policy does not address noise, which this representation has assessed and the plan has not.
We show on the Government's own noise maps that 59 per cent of the allocation, 144 hectares, is already above the World Health Organization's limit for road traffic noise, and the earth bund and fence that would deal with it, which no Council document provides for, takes a 22-metre strip and a further 127 homes (Appendix Q).
Paragraph 6.433 concludes on SS18's landscape effects by reference to "the existing character of West Horndon village". The plan describes the SSSI as "forming the north part of the site boundary" (paragraph 5.6.33, page 295) and, three pages earlier in the vision, "at the southern tip of the site".
The constraints map in the capacity study [14] records "no other protected areas". Since then Natural England concluded on 25 September 2026 that Fell-me-down Shaw, inside the allocation, meets the criteria for ancient woodland, and an application for Lodge Hall Shaw to be added to the inventory on the same evidence is being prepared (Appendix E, item E3): each confirmed shaw takes a 50-metre buffer from the developable land and more homes from the budget, 3,085 after Fell-me-down Shaw and 2,861 after Lodge Hall Shaw on the Council's own capacity figures (Appendix I). The IIA (6.431) says the site is "located next to a SSSI". The plan and its appraisal give four different accounts of where the SSSI is, for one site.
The confusion has a simple explanation. The plan, the appraisal and the capacity study were written as separate pieces of work, by different consultants, for a site none of them had walked, and nobody with knowledge of the ground read them together.
A Site of Special Scientific Interest cannot be at the north and the south of the same site, next to it and not a protected area. Those are the answers of authors who did not know where it was. That matters for soundness: the evidence the Inspector is asked to rely on for this allocation was assembled without local knowledge and never reconciled, and the errors it contains about the one designated site on the boundary are the errors most likely to be repeated about everything else.
3.4 Ground L3: two statutory duties on the Council itself, unaddressed
Most of what a developer must do beside a SSSI belongs to the application stage and this representation does not plead it: the consent Natural England must give for operations within the SSSI (section 28E of the Wildlife and Countryside Act 1981), and the ecological surveys, protected species licences, construction environmental management plan, lighting and drainage designs and biodiversity net gain calculation that a planning application would carry. Those are the lower-order duties. They fall on the applicant, and they can be decided later.
Two statutory duties, however, are of a different order. They bind the local planning authority itself at the plan-making stage, when the decision to place 5,000 homes along the SSSI's southern boundary and inside its Impact Risk Zone is taken. They cannot be left to a future applicant. Neither is discharged anywhere in the plan or its evidence base.
The Impact Risk Zone matters because section 28G is not confined to the SSSI boundary: the duty applies to any function likely to affect the notified features, wherever it is exercised, and the Impact Risk Zone is Natural England's own map of where development is likely to affect them. The whole allocation lies within it.
Section 28G of the Wildlife and Countryside Act 1981. In exercising any function likely to affect the features for which a SSSI is notified, the Council must take reasonable steps, consistent with the proper exercise of that function, to further the conservation and enhancement of those features.
Allocating 250 hectares along the SSSI's southern boundary, inside its Impact Risk Zone, is such a function. No document records that the Council considered the notified features of Langdon Ridge (species-rich neutral grassland, fen meadows, ancient and long-established semi-natural woodland, two invertebrate assemblages and Deptford pink [138]), the active recreational-disturbance pressure Natural England has recorded on them since 2019, or what steps the allocation should take to further their conservation. The word "SSSI" appears in Policy SS18 twice: once to describe the boundary and once to require a greenspace that is not specified. The SSSI's own supporting information describes it as an "archipelago of sites" dependent on "linkage and the avoidance of isolation". The fields the plan allocates are the linkage.
More than that: no document assesses the ecological function of the SS18 land for the SSSI at all. The question the duty required the Council to ask first, whether the species and habitats for which Langdon Ridge is notified depend on the allocated fields, hedgerows and shaws for breeding, foraging, roosting and movement between the parts of the archipelago, was never asked, and no survey, data search or consultation that could answer it is in the evidence base. I am a professional ecologist resident on the boundary, and I attest from my own observation over many years that they do: the fields hold breeding and foraging ground for Red List and legally protected species, including species that nest or forage inside the allocation and move between it and the SSSI's woodland units (Appendix D; section 4.6).
The Council had no such information and sought none. A duty to further the conservation of the notified features cannot be discharged without first knowing what those features need from the land in question, and the record shows the Council never found out.
Section 40 of the Natural Environment and Rural Communities Act 2006. Since January 2023 the Council must from time to time consider what action it can properly take, consistently with the proper exercise of its functions, to further the general biodiversity objective, having regard to the Local Nature Recovery Strategy.
The plan cites the Greater Essex Local Nature Recovery Strategy in general terms. Nothing in the evidence base records that consideration for this allocation, and no species is named in connection with it. The Council's own Biodiversity Action Plan is recorded as "currently out of date". Its Greengrid strategy names species that use these fields. The species of principal importance recorded on and beside the site (section 41; Appendix D) are not mentioned anywhere in the plan or its evidence.
The consequence is plain. A local planning authority whose biodiversity action plan is out of date, which holds no record of the flora and fauna of the land it is allocating or of how their populations use it and move through it, and which has had no condition assessment of the adjoining SSSI since 2018, is not in a position to judge the risks of placing a new town on that land up to the SSSI's boundary, still less to say how those risks would be managed.
The plan nevertheless does both: it allocates the land, and it asserts that a greenspace it has not specified will manage the pressure. Neither statutory duty can be discharged by a body that has not identified the features it must conserve or recorded their use of the land in question, and the record shows that the Council did neither before it decided.
What Natural England holds. Natural England's reply to my information request [137] records that it "holds no information regarding any S28I notice from Thurrock Council or any record of the Council's consideration of its duty under S28G". It also records that, "Despite searches", it was "unable to locate information" on birds, functionally linked land or bat roosts on the land north of the A13, including any supplied by the Council, its consultants or a site promoter, and that there "have not been any further condition assessments since 2018" of Langdon Ridge SSSI, whose condition was assessed only for its notification. The Council allocated land along the SSSI's southern boundary with no species data of its own, none supplied to Natural England, and no current condition baseline for the features the allocation would affect.
This cannot be deferred to a planning application. The decision whether to release this land from the Green Belt is taken once, in the plan, and the Framework requires the exceptional circumstances for it to be "fully evidenced and justified" at that point (NPPF December 2024, paragraph 145). Once the land is allocated the principle of development is settled, and an application can only ask how, not whether.
The ecological evidence that would show whether this land can be built on without harm to the SSSI is therefore evidence the plan needs now, and the plan has none. Nor would an applicant's survey supply it later. A survey made to the standard an application requires, over one or two seasons, is a snapshot. The function of this land for the SSSI is seasonal and cumulative, wintering flocks moving between the estuary and the fields, breeding territories held year after year, badgers foraging out from the woodland units, and those patterns are visible only across years of observation (Appendix D). To release the land first and look later reverses the order the statute and the Framework set, and guarantees that the look, when it comes, is too narrow to see what is being lost.
The Council applied these duties to a disposal, and not to the allocation. The Council's own public statement of 18 September 2026 [93] sets out what it did when a small parcel of its own land adjoining Langdon Hills Country Park was proposed for disposal: on 17 July 2026 its Country Parks team "formally raised concerns regarding the relationship between the land, Langdon Hills Country Park, the Langdon Hills Ridge SSSI and the Higher Level Stewardship arrangements". A review of "environmental constraints, stewardship obligations, legal advice and the operational relationship between the land and Langdon Hills Country Park" followed. On 13 August 2026 "the woodland and SSSI were excluded from the proposed acquisition", and the land "will remain in Council ownership". That is the section 28G duty in operation, for a small parcel, and the parcel lies inside the SS18 allocation itself, within Corringham Park Farm beside Hovels Farm (the Council's own location plan for the asset, "Land at A13 Corringham and Land East of One Tree Hill", is in the report to Cabinet of 18 March 2026, "Next Tranche of Assets for Disposal", Appendix 2, page 3 [146]).
Thirteen days later, on 26 August 2026, the Council allocated the land around it for housing. The Council keeps its own parcel as green space. The allocation builds right up to it and around it.
The protection the Council gave that parcel followed from who owned it (the Council), not from what it adjoins. The fields on either side have the same relationship with the same SSSI and the same Country Park, and nothing in the evidence base distinguishes the parcel from them except that the Council owns it and the fields in SS18 are owned privately.
The question the Council asked for its own few hectares, and answered in favour of protecting the SSSI, it did not ask for the 250 hectares around them: the evidence base contains no record of the same review for the allocation.
And a strip of green space kept inside a new town, with houses built up to its edges, does not protect the SSSI it was kept for. The full record behind the withdrawal is the subject of an outstanding information request (Appendix C).
These duties are pleaded under legal compliance because they are statutory and fall on the Council, and under "consistent with national policy" (section 6.2) because the NPPF gives them effect.
They answer the Council's standard reply that ecology is a matter for the application: the plan-making authority has its own duties toward this SSSI that had to be discharged before the land was allocated, and the record contains no sign that any of them was considered. No document in the evidence base records either duty being addressed for this allocation. A record produced now would post-date the decision it was required to inform.
3.5 Context: what the public was consulted on
This point is recorded so that the Inspector has the sequence. It is not put as a freestanding legal ground. The Regulation 18 Initial Proposals [48] (December 2023) placed Lower Langdon in a section headed "New Place Opportunity Areas" and said of it: "At this stage we do not have enough information to be able to include this new place as part of our initial proposals" (page 150).
It listed five pieces of work to be done before the next stage: transport modelling, an infrastructure delivery plan, the Stage 2 Green Belt assessment, a strategic flood risk assessment, and "stakeholder engagement with National Rail and C2C". Corringham Park Farm was not shown. Of the five, the Green Belt assessment was done and recommended against the land (section 4.2). The flood assessment is an unapproved draft with no site model (section 4.6). No published record shows engagement with Network Rail or c2c (section 5.3). The professional appraisal then left the site out of the preferred strategy, and it was reinstated afterwards with no justified reason (section 3.2). The public has been consulted once on the allocation of this site, at Regulation 19, at a stage the Cabinet report [4] (paragraph 4.25) says cannot be materially changed. Basildon Borough Council (IP0024) and Essex County Council (IP0104) both asked at Regulation 18 to be engaged in the further evolution of the proposal. No statement of common ground with either has been published (section 5.5). (Initial Proposals 2023, pages 150 to 154; Regulation 18 Consultation Statement [7])
What the Council said about this land in 2023, and what the plan dropped. The same Initial Proposals [48] (Section 7, Lower Langdon, printed pages 147 to 150) set three conditions for this land. The published plan meets none of them.
-
Noise from the A13. In 2023: "The proximity of this site to the A13 will limit the developable area of the site as well trigger the need to consider ways to reduce the impact noise could have on future residents" (pages 147 to 148).
In 2026 Policy SS18 and its supporting text (pages 291 to 296) do not mention noise at all. The capacity study counts the land along the A13 as developable, and no noise assessment exists. On the Government's own noise maps 59 per cent of the allocation is above the World Health Organization's limit for road traffic noise (Appendix Q).
-
Flooding downstream in Stanford-le-Hope. In 2023: "surface water runoff from the far southwestern corner of the site affects flooding in of [sic] Stanford-le-Hope", and drainage "would need to be integrated ... to prevent the risk of flooding downstream" (pages 148 and 150). In 2026 the policy treats flood risk only as a constraint within the site ("areas of higher flood risk on site", part D.2; paragraph 5.6.34) and does not mention Stanford-le-Hope's flooding at all. No site flood model exists (section 4.6).
-
20 per cent biodiversity net gain. In 2023: development must ensure "that a 20% biodiversity net gain is achieved" (page 150). In 2026 the plan keeps 20 per cent for West Horndon ("A biodiversity net gain of 20% will deliver significant habitat improvements", page 281) but sets no figure for SS18, which falls to the 10 per cent minimum of Policy DMP24 because "Thurrock's own viability study indicates the national minimum standard of a 10% biodiversity net gain is more appropriate" (paragraph 6.5.3, page 332): the protection was cut for the site beside the SSSI, on viability grounds, at the same time as the Council's viability evidence found that site unviable (section 5.2).
The Council identified these three problems itself before it had commissioned any of the evidence, and the evidence it then commissioned did not resolve them. The plan resolved them by leaving them out.
Three further facts from the Council's own consultation record. The Regulation 18 consultation closed on 19 February 2024. The Call for Sites, through which the Corringham Park Farm land was promoted, stayed open until the end of January 2025, eleven months later, so the public consulted in 2024 could not have commented on land that was not yet before the Council.
The Consultation Statement records 1,314 representations from 1,034 respondents. Of the 899 individuals who responded, 336 disagreed with the proposals and 37 agreed. 188 responses came from landowners and developers. And the Statement's own section 7.8 records that "healthcare capacity was one of the most significant concerns across the consultation, particularly in relation to GP surgeries, Basildon Hospital and future healthcare provision", to which the Council's standard reply was that an Infrastructure Delivery Plan [30] was being prepared. When it appeared it contained no acute hospital item and had been produced without consulting the trust that runs the hospital (the hospital's condition, the rating the IDP misstates and the attendances the allocation implies are set out in section 5.3 and Appendix P).
A Basildon councillor (IP0242) objected that "building on the Thurrock side of Langdon Hills will result in flooding". Anglian Water (IP0015) supported growth on the basis of "a sustainable drainage network, which could provide opportunities for wider integrated water management". Neither the drainage network nor the flood model exists.
3.6 The findings sought on the legal grounds
Each of the following is a question of legal compliance on which the plan cannot lawfully proceed with Policy SS18 unless it is answered in the Council's favour. I ask the Inspector to reach and record a finding, with reasons, on each:
1. Whether the Habitats Regulations Assessment accompanying the plan assesses the allocation of approximately 250 hectares north of the A13 made by Policy SS18, as regulation 105(1) of the Conservation of Habitats and Species Regulations 2017 requires (section 3.1).
2. Whether the Assessment's conclusion of no adverse effect on the integrity of the Thames Estuary and Marshes SPA and Ramsar site through water quality rests on mitigation that is certain and effective for the works that will receive the plan's sewage, Anglian Water's Tilbury Water Recycling Centre, rather than on Southern Water's measures in Kent (regulation 105(4); People Over Wind [104]; Holohan [105]) (section 3.1).
3. Whether, on the Assessment as published or as supplemented, it can be ascertained that the plan with Policy SS18 will not adversely affect the integrity of any European site, including through functionally linked land, recreational pressure and air quality in combination with the Lower Thames Crossing (regulation 105(4)) (section 3.1).
4. Whether the mitigation on which the policy relies for Langdon Ridge SSSI and the estuary sites, a Suitable Alternative Natural Greenspace with no area, location, cost or delivery body, is identified with the certainty the Regulations require (section 3.1).
5. Whether the sustainability appraisal identified, described and evaluated the strategy the plan adopts, West Horndon with Lower Langdon, as a reasonable alternative, and gave reasons for selecting it over the alternative the appraisal scored better (SEA Regulations 2004, regulation 12 and Schedule 2; PCPA 2004 section 19(5)) (section 3.2).
6. Whether the Council discharged its duties under section 28G of the Wildlife and Countryside Act 1981 and section 40 of the Natural Environment and Rural Communities Act 2006 in allocating land on the boundary of Langdon Ridge SSSI (section 3.4).
If the Council submits, or is invited to prepare, any addendum to the Habitats Regulations Assessment or the sustainability appraisal, or any further evidence on these matters, I ask to be consulted on it and to be heard on it before the matter is determined, so that the evidence in this representation (including the Environment Agency's storm overflow record for Tilbury, the survey data described in section 1, and Natural England's recorded position) can be set against it.
4. Justified
The test: the plan must be "based on proportionate evidence and represent the most appropriate strategy when reasonable alternatives have been considered". For Policy SS18 the Council's own evidence points the other way on every element. Each ground below is drawn from a document the Council commissioned for this plan.
4.1 Ground J1: no exceptional circumstances are demonstrated for this site
The requirement. Green Belt boundaries may be altered only where "exceptional circumstances are fully evidenced and justified" (NPPF December 2024 [74], paragraph 145).
Before concluding that such circumstances exist, the authority must show it has "examined fully all other reasonable options for meeting its identified need for development", including making as much use as possible of brownfield land, optimising density, and discussing whether neighbouring authorities can accommodate some of the need (paragraph 146).
Where release is necessary, plans "should give priority to previously developed land, then consider grey belt which is not previously developed, and then other Green Belt locations" (paragraph 148). Need alone does not amount to exceptional circumstances. The authority must consider the acuteness of the need, the constraints on other supply, the difficulty of achieving sustainable development without Green Belt release, the harm to the Green Belt, and the extent to which that harm can be reduced (Calverton Parish Council v Nottingham City Council [2015] EWHC 1078 (Admin), paragraph 51).
What the plan says. The plan's whole exceptional circumstances case is paragraph 4.2.6 (page 34): "In this context and having regard to the exceptional circumstances test for amending Green Belt boundaries, the Council considers that such circumstances are met. This reflects the scale of housing and employment growth required to support Thurrock's role in the regional and national economy, the limited capacity of suitable brownfield land, and the need to deliver sustainable patterns of development." It is generic and borough-wide.
The statement that "exceptional circumstances" are "met" names no site, cites no evidence, and does not state how much Green Belt the plan releases. There is no site-specific exceptional circumstances case for SS18 anywhere in the plan or its evidence base.
Nor does the plan offer any analysis of its one stated reason, that economic growth requires more homes. This representation has tested that proposition against the borough's own record, and it does not hold: between 2015 and 2024 Thurrock added about 15,000 jobs, more each year than the plan's higher growth scenario assumes, and about 5,100 homes, about 2.9 jobs for every new home against the 1.08 the Housing Needs Assessment converts at. The jobs came without the homes, because most of them are filled by people who travel in, whom the assessment does not model (section 4.5; Appendix G). The premise on which the exceptional circumstances are said to rest is not evidenced anywhere, and where it can be tested it is contradicted by the Council's own data.
The need does not require this site. The Housing Land Availability Assessment (HLAA, October 2025 [38], paragraph 3.1) identifies "a potential housing capacity of 50,128 dwellings from sites that have been identified as being suitable, available and achievable, without having to rely on sites that the HLAA has deemed to be unsuitable for development". The Government's standard method minimum is 21,480 homes over the plan period (plan paragraph 4.2.2). Without SS18, the plan's supply within the period is 22,006 homes (Table 2, page 43: 25,406 less SS18's 3,400 in the plan's Appendix 2, page 415), above the minimum. Section 4.5 addresses the Council's chosen requirement of 28,880.
The release sequence was not followed. The Framework prescribes a procedure for releasing Green Belt, the Council did not follow it, and had it done so this site would have failed at the first step.
Paragraph 146 requires the authority, before any release, to show that it has examined all other reasonable options: an urban capacity study, a density test, a justified windfall figure and its neighbours' capacity. Paragraph 148 then requires it to give first consideration to previously developed land, second to grey belt, and only then to other Green Belt. SS18 is neither previously developed land nor grey belt (section 4.2). It is "other Green Belt", the last category paragraph 148 permits, which may be released only once the earlier categories have been shown to be insufficient. The Council's Site Selection Methodology [37] cannot deliver the sequence, because it records Green Belt status "for information" only, carrying no weight in the site score, and states that "it was identified early in this process that there wasn't a sufficient supply of sites on previously developed land to achieve the housing need" (page 11), a conclusion reached before the HLAA had established a capacity of 50,128.
The methodology omits Natural England's SSSI Impact Risk Zones entirely, and its isolation filter rules out small isolated sites as unsuitable while retaining large ones as "potential new settlements", so that the larger the Green Belt incursion, the easier the filter is to pass.
The plan does not record, for SS18 or for any of the seven allocations its Green Belt consultant recommended against, why the Council departed from that advice.
Had the procedure been run, SS18 would not have reached the point of release: the Council's own Green Belt assessment rates the land "Provisional Grey Belt: No" with "Fundamental" harm, and its own housing land study finds 50,128 homes of suitable, available and achievable capacity against a 21,480 minimum, so the stage at which "other Green Belt" may be considered is never reached.
The procedure was not followed, and if it had been, this site would have failed it. (Site Selection Methodology, July 2026, pages 10 to 14)
The plan's own Green Belt strategy excludes this land. The plan's Green Belt chapter (paragraph 6.8.3, page 361) says the exceptional circumstances case rests on parcels that "make only a limited contribution to preventing sprawl, preventing settlement coalescence or safeguarding the countryside from encroachment", identified as grey belt, and describes that case as "emerging".
SS18 is not one of those parcels. The Council's own Green Belt consultant said so: sub-area CS-01, 221 hectares of the site, is "Provisional Grey Belt: No". Its contribution to preventing neighbouring towns from merging is scored 5 out of 5, "Strong", the only sub-area in the borough to score the maximum on that purpose. The harm of release is "Fundamental". Release "would lead to the physical merging of neighbouring towns" (Stage 2 Green Belt Assessment [12], Table 26, page 62; section 4.2).
The plan's stated case for release therefore excludes this land twice over: SS18 is not grey belt, and it is the land the consultant found does most of the one thing the plan says its released parcels do least. The plan releases Green Belt for 19,249 homes within the period and 9,300 after it (the sites marked "Y" for Green or Grey Belt in the plan's Appendix 2, pages 414 to 419). SS18's 1,600 post-period homes are Green Belt release for a need this plan does not have. The NPPF's route for land wanted after the plan period is safeguarded land, identified but not allocated (paragraph 149(c) and (d)). The Council did not use it.
The quantum of Green Belt release against the shortfall. The plan's own tables allow the calculation the plan does not make. Non-Green Belt supply within the period is about 7,500 homes: completions 407, permissions 1,800, windfalls 1,400, allocations not on Green or grey belt about 3,900 (Table 2).
The standard method minimum of 21,480 therefore needs about 14,000 homes from Green Belt. The plan allocates Green Belt for 19,249 homes within the period and 9,300 after it: a release about 5,200 homes above what the minimum requires within the period, and 9,300 homes for after the plan ends. SS18's 3,400 in-period homes sit inside the 5,200 surplus. On the promoter's own account the figure is lower still, because the 600 homes the trajectory counts from SS18 in 2029/30 to 2033/34 fall inside the first five years from adoption, in which the promoter told the Council's viability consultants the site "was not expected" to contribute (Viability Assessment [29], paragraph 8.67; section 5.1), so the most the plan can count from SS18 within the period is about 2,800. Its 1,600 post-period homes are release for a need this plan does not have. That is close to the 2023 appraisal's "no Green Belt release" option of 7,320 homes (2023 IIA [50], paragraph 2.65), so some release is unavoidable. What the plan never shows is why it releases about twice the Green Belt the shortfall requires, and why this land.
What the scoring gave no weight to. The Site Selection Methodology records the following "for information" only, with "no impact on the balance score": Green Belt, Agricultural Land Classification, the Priority Habitat Inventory, Critical Drainage Areas, the Horndon-on-the-Hill and Fobbing Conservation Areas, Landscape Character Areas, topography, public rights of way and archaeology. Each of those counts heavily against this site. The IIA scores SS18 significant negative for soils, and Natural England's provisional map shows about 5.4 hectares of Grade 2, best and most versatile land, and 209 hectares of Grade 3 never surveyed to distinguish 3a from 3b [121]. The IIA's own site framework (Table D.12, criterion 15c) treats intersection with priority habitat as a major negative, yet the site scoring treats it as information. The Landscape Sensitivity and Capacity Analysis [16] rates Character Area J1, which contains this site, "very high" in susceptibility and high in sensitivity to a very large housing area (Table 48, page 113). The site rises to a SSSI ridge and is crossed by a footpath network. All of the factors that count most against this site were left out of the scoring. Had they been scored, the site would have failed the Council's own suitability test.
SSSI Impact Risk Zones appear nowhere at any level.
This is not an oversight in the application of the method. It is the method. The Council designed a scoring system in which the factors that decide whether Green Belt beside a SSSI can be released at all, the Green Belt purposes the land serves, its agricultural grade, its priority habitat, its landscape sensitivity and its proximity to the SSSI, carry no weight by construction. The result is a test that no site could fail on the considerations that matter most, however badly it scored on them.
A site that the Council's own consultants rated the most harmful Green Belt release in the borough, with very high landscape susceptibility, best and most versatile land and priority habitat, passed through the sift with those findings recorded "for information" and counted for nothing. A method that cannot register the constraints that matter most is not proportionate evidence for the choice it produces.
No sequential audit exists: nothing in the evidence base records, for the plan's 74 allocations, how many are previously developed land, how many grey belt, how many other Green Belt, with the yield of each, or whether every previously developed and grey belt opportunity was exhausted before other Green Belt was released. On the Council's own consultants' findings, set out below, an audit produced now could not place SS18 anywhere but last: it is neither previously developed nor grey belt, and it is the only strategic allocation that fails every constraint the consultants measured.
What the score measured. The balance score starts at 100 and deducts penalties for 23 listed constraints according to a published matrix (Site Selection Methodology [37], pages 8 to 10; HLAA Appendix 1 [125], Table 2, page 11). An SSSI is an "absolute constraint" that removes only land lying inside it (Methodology page 9). Land next to one loses nothing. Lower Langdon (site 60940) scored 68.75, "reduced due to part of the site falling within Flood Zones 2 & 3 and within a Local Wildlife Site" (HLAA [15], Appendix 4, page 36).
On the published matrix a flood penalty of 31.25 accounts for the whole reduction: Flood Zone 3 over 10.7 per cent of the site (High, Minor, 18.75) and Flood Zone 2 over a further 5.3 per cent (Medium, Minor, 12.5). The two Local Wildlife Sites in Parcel a cover about 2.4 per cent, under the 5 per cent threshold, and cost nothing. One of them, Fell-me-down Shaw, has since been confirmed by Natural England as ancient woodland (25 September 2026; Appendix E, item E3), an irreplaceable habitat under the Framework. Ancient woodland is an "absolute constraint" in the method (Methodology, Table 2, page 9), which clips the wood itself out of the site and penalises nothing around it: on this method a confirmed ancient wood inside the allocation changes the score by nothing at all. The Council does not publish the level it gave each constraint. This reconstruction reproduces its other published scores, including West Horndon's 50 (Flood Zone 3 on 25.7 per cent, Flood Zone 2 on 19.9 per cent). In effect, flooding was the only factor that counted in the suitability score.
The SSSI along the northern boundary, the Green Belt, the priority habitat and the landscape cost the site nothing during scoring. [132]
What national guidance required. Planning Practice Guidance on land availability assessment [126] says that assessments "should reflect the policies in footnote 6 of the National Planning Policy Framework, which sets out the areas where the Framework would provide strong reasons for restricting ... development in the plan area (such as the Green Belt and other protected areas)" (Paragraph 002, 3-002-20190722). It adds that where authorities depart from the guidance "it will be important to explain the reasons for doing so" (Paragraph 004), and that suitability factors include "potential impacts including the effect upon landscapes including landscape features, nature and heritage conservation" (Paragraph 018). The Council's HLAA Appendix 1 [125] reproduces that list (paragraph 2.17) and then records landscape and priority habitat "for information" only.
The point is this. The guidance told the Council to score sites against the Framework's list of protected areas (footnote 7 of the current Framework, footnote 6 of the version the guidance cites), and the Green Belt is on that list. The Council's method marked sites down for only one item on that list, flood risk. It gave the Green Belt no weight at all, and the only reason it gives is the early judgement on previously developed land noted above.
Other authorities do otherwise. Epsom and Ewell scores sites against Natural England's Impact Risk Zones and rates a site red "Within 50m of Epsom Common SSSI" [127]. Cheshire East took Green Belt sites only where non-Green Belt land was insufficient, then "sites previously-developed and/or ... well-served by public transport ... first, followed by those sites that had the lowest contribution to Green Belt purposes" [128]. Natural England has advised that the Impact Risk Zones "should be used to screen all new development proposals and site options" [129].
What one unexplained choice decides. Applying the Council's own matrix with a Green Belt penalty at its middle level (Medium: 50 for a majority overlap) makes 25 of the 172 scored suitable sites unsuitable. They include Lower Langdon, which already carries the flood penalties. 84 of the 109 Green Belt sites would still pass. The Council's methodology says "the sites are ranked such that a balance score of 100 is the most suitable" (HLAA Appendix 1 [125], paragraph 2.24). On that ranking 130 suitable sites scored higher than Lower Langdon, 77 of them sites the plan does not allocate: sites that did better than SS18 on the Council's own measure were left out, and the site that does worse than every other strategic allocation on each constraint the measure never counts was put in.
The test shows that the result turns on a choice the Council did not explain. It does not claim to show the "right" score. Nor does the score make a case for any site by comparison with another. The score is a count of flood zones, not a measure of suitability, and a site that passed the sift on a lower score has nothing to say for SS18: the question on this ground is not how SS18's number compares, but whether the evidence for it exists, and on the Green Belt, landscape, heritage, habitat, viability and delivery evidence the score never counted, SS18 stands alone among the strategic allocations in failing all of it. [132]
Land the Council's own assessment rejected. The plan allocates three housing sites that the Council's own Housing Land Availability Assessment had found unsuitable or unavailable ten months earlier.
Two are small: Rippleside Metalworks, Grays (NS11, 170 homes), rejected on a balance score of 12.5, and a car park at East Tilbury (NS22, 7 homes), recorded as "Unavailable". The third is Corringham Park Farm (site 60893), the 1,000-home founding phase of SS18, rejected as "Unsuitable - Proximity to settlement": in the HLAA's own words, the site "is located separate from existing settlements and is not of sufficient scale to form a standalone settlement" and "is considered to be unsuitable for development" (HLAA Appendices [15], site 60893). The HLAA's threshold for a standalone settlement is "3,000+ homes" (HLAA Appendix 1 [125], paragraph 2.29).
The point is a simple one. In October 2025 the Council's own assessment found that the Corringham Park Farm land was not next to a settlement and was too small to be one. In August 2026 the plan made the same land the first phase of a new settlement. Nothing in the evidence base records the land being assessed again, or explains what changed. The only difference is that the policy now names it alongside Lower Langdon. It is not joined to Lower Langdon on the ground: the two parcels are hundreds of metres apart at their nearest point and 2.5 kilometres apart at their centres (section 4.2), and a parcel that fails the Council's test on its own does not pass it by being given the same policy number as another.
This representation's re-score, on the Council's own consultants' findings. Because the Council's method weighted none of it, this representation tabulates what the Council's own consultants found for each of the nine strategic allocations: Green Belt sub-area recommendation (Arup), grey belt status, heritage rating (Place Services), share in Flood Zone 3 and in the Environment Agency's future flood extent, Main River, and the Council's own sequential test rank. It is not a new score and applies no weights of its own: each cell is the consultant's published finding or the Environment Agency's mapped extent for that site, set side by side so that the sites can be compared on the same evidence (method, sources and limits at Appendix M). SS18 is the only allocation that fails every column: "Not recommended", "Strong", "Fundamental" and 5 of 5 on purpose (b), not grey belt, "Moderate Adverse ... should be avoided", 10.7 per cent of Parcel a in Flood Zone 3 and 16.8 per cent in the future flood extent, 0.96 km of Main River, and a first-phase parcel the HLAA classed "Unsuitable".
West Horndon fails on Green Belt, heritage and flood but is grey belt on the purposes test and has a station. Every other site passes at least one column.
The comparison is made to show that SS18 stands apart, not to impugn the other allocations, which are for their own representors and are not the subject of this representation. In proportion: the Stage 2 assessment found 816 hectares, 7 per cent of the borough's Green Belt, fit for further consideration. SS18, at about 250 hectares, is the largest single block the consultants recommended against that is not grey belt, and on its own is 2.1 per cent of the borough's Green Belt. (Appendix M; Stage 2 Green Belt Assessment (GBA) [12] section 7.12, Table 32; sub-area matching for sites other than SS18 is by description and should be confirmed by the Council)
Brownfield: what the register shows, and what the Council did not do. The Council's Brownfield Land Register [120] (1 April 2024) lists 25 sites, 83.5 hectares, 3,755 to 3,950 dwellings, three quarters of them at Purfleet Centre (2,850). That register has not been reviewed since 1 April 2024, although regulation 17 of the Town and Country Planning (Brownfield Land Register) Regulations 2017 requires every entry to be reviewed at least once a year. CPRE's national State of Brownfield report (September 2026), compiled from every council's published register, records Thurrock's April 2024 register as its latest. The plan's statement that suitable brownfield land is limited (paragraph 4.2.6) therefore rests on a register two and a half years old, which the Council has not kept up to date as the law requires [147].
The Council has made no active search for brownfield land. Its register has not been reviewed since April 2024, and there is no urban capacity study and no density test. Brownfield alone cannot meet the standard method minimum, and this representation does not say it can. What paragraph 146 requires before any release, an urban capacity study, a density test, a justified windfall allowance and discussion with neighbours, has not been done. The register is not that examination. The Council's own HLAA holds 17,055 homes on 79 sites it found suitable, available and achievable that the plan does not allocate, 1,014 of them outside the Green Belt and 1,444 on previously developed land within it (HLAA Appendix 4 [15]; [124]), and its consultant identified 816 hectares of Green Belt recommended for further consideration, yet the Council took the one large sub-area in the borough that is neither recommended nor grey belt.
Put plainly: the Council's own assessment found sites outside the Green Belt, and previously developed sites inside it, that are suitable, available and achievable, and the plan leaves them out while allocating greenfield Green Belt that its own consultant recommended against.
The Framework sets the order: before any Green Belt is released the authority must show it has examined all other reasonable options for meeting its need (paragraph 146), and when it does release Green Belt it must take previously developed land first, grey belt second and other Green Belt last (paragraph 148).
The plan gives no reason for passing over the 24 non-Green Belt sites (1,014 homes) or the four previously developed Green Belt sites (527 to 1,444 homes) in favour of SS18, and no document in the evidence base records that choice being made. On the Council's own figures those sites of ten or more homes, added to the plan without SS18, would lift supply within the period to between 7.9 and 12.2 per cent above the Government minimum without taking any greenfield Green Belt (section 7.1).
This representation does not promote any of them. The point is that the Council held the alternatives national policy requires it to examine first, and the record shows no examination. (Appendix N)
The land was chosen because it was offered, not because it was found. Both SS18 parcels entered the Council's evidence the same way: each was "submitted to the Call for Sites by the landowner and/or site promoter" (HLAA [15], Appendix 4, page 36, site 60940, source "Call-for-Sites Submissions", and HLAA Appendix 2, site 60893). The Council's own Site Selection Methodology [37] records that "most sites promoted to Thurrock Council in response to the call for sites exercise were not within existing urban area and were within the Metropolitan Green Belt", and quotes the Government's guidance that "plan-makers do not simply rely on sites that they have been informed about but actively identify sites" (paragraphs 3.1.2 and 3.1.3, pages 7 to 8).
The active search it then describes is a review of past planning applications, of Council-owned land and of existing urban areas, including the brownfield register. It contains no urban capacity study and no test of higher densities, and it stops at the edge of the towns. The one borough-wide search of the Green Belt the Council did commission, the Stage 2 Green Belt Assessment, recommended 816 hectares for further consideration and recommended against the SS18 land (section 4.2).
The plan took the land its own search rejected and a promoter offered. Natural England told the Council in February 2024 that the site "should not be taken forward until alternative site options have been fully considered" (IP0179; section 3.4). No document records that consideration: the sustainability appraisal never compared the adopted strategy with the alternatives, the only option containing Lower Langdon scored worse than the option without it on eight objectives (section 3.2), and the suitable sites in the Council's own housing land study were never weighed against SS18. Natural England's condition was not met, and the examination of reasonable alternatives that the justified test (NPPF paragraph 36(b)) and paragraph 146 require has not been done.
The Council's own decisions on the SS18 land and its boundary roads. The Council's online planning register records 425 applications since 1948 at the eight addresses within and around the SS18 allocation (Old Hill Avenue, South Avenue, Vange Park Road, One Tree Hill, Park Road, Hovels Farm, Arden Hall and North Hill), and 168 refusals [122]. Of the 40 whose decision notices are online, 20 were refused primarily on Green Belt grounds, continuously from 2012 to January 2026: extensions, outbuildings, caravans, stables and single dwellings, each because it would harm openness.
The Council's own words: "an unacceptable urbanising feature which is harmful to the openness and rural character of the Green Belt" (land adjacent One Tree Hill, 2012), "would harm the openness of the Green Belt and would be contrary Green Belt purpose (c)" (South Avenue, 2021 and 2022), "inappropriate development in the Green Belt which is by definition harmful" (Old Hill Avenue, 2020).
Seven months after the most recent refusal the Council allocated the same land for 5,000 homes, on a three-sentence borough-wide exceptional circumstances paragraph that does not record why the harm it found in every one of those decisions no longer applies. Its own Green Belt consultant, in February 2026, said nothing had changed: the land "performs strongly" and is "not recommended".
The point is one of consistency. For decades the Council refused single dwellings, extensions, stables and caravans on this land because each would harm the openness of the Green Belt, and its consultant confirmed in 2026 that the harm is undiminished.
The allocation sets that reasoning aside without a word of justification, for a development whose harm to openness is not of the same order as those applications but of a different kind altogether: 5,000 homes on about 250 hectares, which would do more to the openness of this Green Belt than every one of the 168 refused applications combined.
A decision-maker is entitled to change its mind, but it must say why. The Framework requires exceptional circumstances to be fully evidenced and justified, and the record contains no reason why the harm the Council found in every one of those decisions does not apply to the largest proposal the land has ever seen. (Appendix L, Figure L1)
Test engaged. Justified, consistent with national policy (section 6.1).
The Council will say (Compton Parish Council v Guildford Borough Council [2019] EWHC 3242 (Admin)) that exceptional circumstances are a matter of planning judgement and may be found at the level of the plan as a whole. That is right as far as it goes.
It does not relieve the Council of showing, for a specific 250-hectare release its own consultant recommended against, abutting a SSSI whose conservation and enhancement it has a statutory duty to further (section 28G of the Wildlife and Countryside Act 1981), why this land rather than the 17,055 homes on sites its own HLAA found suitable, available and achievable and the plan does not allocate, or the grey belt the plan's own strategy says it prefers. No such reasoning exists to be judged.
4.2 Ground J2: the Council's own consultants advised against every part of the site
Green Belt. The Stage 2 Green Belt Assessment [12] (Arup, February 2026, Appendix 4.5 [13]) assesses the Lower Langdon parcel as sub-area CS-01, 221.46 hectares.
Its findings: "The sub-area forms a substantial part of the gap between Corringham and Basildon ... It is judged that development in this sub-area would lead to the physical merging of neighbouring towns." Release "would represent a significant sprawl of development into previously undeveloped countryside and would be a significant step towards the merging of Corringham / Stanford-le-Hope with Basildon." "If the sub-area were to be released, the new inner Green Belt boundary would not meet the NPPF definition and would require strengthening."
Recommendation: "The sub-area performs strongly against the NPPF purposes and makes an important contribution to the wider Green Belt. Not recommended for further consideration in isolation." Scores: 5 of 5 for preventing towns merging (the only sub-area in the borough to score 5 on that purpose, Table 26, page 62), 4 of 5 for safeguarding the countryside, harm "Fundamental".
Grey belt: "No – The parcel scores strongly against one or more of purposes (a), (b) and (d)." The same proforma records "Yes - Flood Zone 3B" as a constraint.
The Corringham Park Farm parcel is sub-areas CS-11 and CS-28, both "Not recommended for further consideration". CS-11's "inner edge is aligned with the Langdon Ridge SSSI" and its release "would create urbanising influences on Green Belt to its north". CS-28's removal "would create a 'hole' in the Green Belt".
Every sub-area SS18 is made of was recommended against, by the Council's own consultant, under purpose (b) criteria rewritten in February 2026 to the current Planning Practice Guidance [76] (Table 18, page 52), six months before Cabinet approved the plan. (Stage 2 Green Belt Assessment Appendix 4.5 [13], pages 2 to 5, 42)
Housing land. The HLAA [38] (October 2025) classed site 60893, "Corringham Park Farm and Hovels Farm, One Tree Hill", as "Unsuitable - Proximity to settlement": "Site is located separate from existing settlements and is not of sufficient scale to form a standalone settlement. Site is considered to be unsuitable for development." Ten months later it is Parcel b of SS18, allocated 1,000 homes and designated the first phase of the whole settlement.
Nothing about the land changed. Corringham Park Farm is not joined to Lower Langdon: the two HLAA site polygons are about 200 metres apart at their nearest point and about 2.5 kilometres apart at their centres, with land outside the allocation between them, and Parcel b has its own access, its own frontage to the A13 and its own 1,075-metre boundary with the SSSI. The policy puts one number over both, but on the ground Corringham Park Farm remains what the HLAA assessed: a parcel on its own, "separate from existing settlements", that cannot form a settlement and is not part of another.
The Lower Langdon parcel, site 60940, was assessed as suitable for 3,378 homes on 112.61 developable hectares, with Flood Zones 2 and 3, a Local Wildlife Site and a high-pressure gas pipeline recorded as constraints "which may be difficult to mitigate". The policy allocates 4,000. (HLAA Appendices [15], sites 60893 and 60940)
Three points follow from the 60940 record. The Council's own capacity for Parcel a is 3,378 and the policy allocates 4,000, 18 per cent more. The constraints the HLAA itself flagged, flood zones, a Local Wildlife Site and a gas pipeline "difficult to mitigate", are reflected in no later suitability judgement. And the record confirms a Call for Sites submission for this land by "the landowner and/or site promoter", the document the Council has been asked to produce.
Heritage. The Heritage Impact Assessment [36] (February 2026, published 13 August 2026) rates site 60940 "Moderate Adverse" for built heritage, a grade it defines as harm that "is considerable. There are likely no options for mitigation ... Proposals causing this level of harm to the significance of a heritage asset(s) should be avoided."
The reasoning: four listed buildings lie within 250 metres of the western boundary (Wrens Park, Arden Hall, its dovecote and outbuildings), and the south-western corner is 435 metres from the historic core of Horndon on the Hill and its Conservation Area, "which contains one grade I, two grade II* and fourteen grade II Listed Buildings".
The plan's response (paragraph 5.6.35, page 295) is that "there are no heritage assets within either section of the site", which is true and beside the point: the harm identified is to setting. No weighing of that harm against public benefit, as NPPF paragraph 215 requires, appears anywhere. Historic England, the Government's adviser on the historic environment, confirmed to me on 5 October 2026 that it has no record of being consulted on SS18 before the Regulation 19 plan, and that it is not aware of having reviewed or commented on any Heritage Impact Assessment for it [136]. Its only advice on the plan is its Regulation 18 response of 16 February 2024.
That response from Historic England expected site Heritage Impact Assessments "ahead of the Regulation 19 plan", to determine whether sites are suitable for allocation and to inform their capacity. It did not comment on Lower Langdon, which was then a "New Place Opportunity Area" in Section 7 of the Initial Proposals [48]: Historic England said that "owing to a lack of capacity" it had been unable to review every section of the plan. The Council answered that it would "prepare a comprehensive Historic Assessment to inform the next stage of the plan" (comment IP0137) [7]. It did.
The assessment found harm that "should be avoided", and the land was allocated without the assessment being put to Historic England. No response from Historic England to this allocation can therefore be read as acceptance of it. On 5 October I sent Historic England the assessment's findings and asked it to state its position in its Regulation 19 response (Appendix E4).
The Heritage Impact Assessment labels the site "SS18 (Plan B) Land north of Stanford Le Hope", 216.30 hectares, 3,941 homes: the figure the IIA [8] appraised, not the 4,000 the plan allocates. Across the borough the same assessment gives 8 "Major Adverse" and 21 "Moderate Adverse" ratings, each defined as harm that "should be avoided", and the plan allocates every one. A council that allocates in the face of that advice on every strategic site cannot say it weighed the harm on this one.
Viability. The Viability Assessment [29] (AspinallVerdi, June 2026, Table 8.2, PDF pages 168 to 170) gives site 60940 a residual land value of minus £9,802,648 against an existing use value of £5,344,773, and a maximum viable affordable housing contribution of 34 per cent. Site 60893 has a residual land value of minus £913,632 and a maximum of 39 per cent. Paragraph 8.65: "The site is shown to be unviable with the inclusion of 50% affordable housing (in line with the Golden Rules)." Policy DMP12 (Table 5, page 317) requires 35 per cent on SS18, more than the Council's own evidence says Parcel a can give. The consultants record that the Council "instructed [them] to consider the affordable housing contribution as the variable output in order to maintain viability" (paragraphs 9.18 to 9.19). Those are the Council's figures for a site with none of its own constraints drawn on it.
This representation has rebuilt the land budget with the constraints the Council's own policies and its own consultees require (the drainage land Policy DMP29 and the national SuDS standard need, buffers to the ancient woodland and the SSSI) and the two the plan does not provide for at all (the A13 noise bund and the SANG to Natural England's standard), and carried each step through the Council's own printed appraisals, which the rebuild reproduces to the pound. The affordable housing the site can support falls from the Council's 34 per cent to 17 per cent at the Council's own capacity of 3,841 homes, to 5 per cent with the drainage land set aside, and to none once the SSSI buffer is applied. With the bund and the SANG as well, the site holds only 2,126 homes. Moreover, the land is £95 million to £102 million short at the plan's 35 per cent affordable housing. "Short" means that, once every cost and a normal developer's profit are paid, the value left for the land is £95 million to £102 million below the land price the Council's own test requires, before the landowners receive anything. No affordable housing is viable on any land price test (section 5.2; Appendix I for the land budget, Appendix J for the viability rebuild).
Landscape and the 2023 appraisal. The Landscape Sensitivity and Capacity Analysis [16] (May 2026) was commissioned by the Council as part of the evidence base for this plan and covers the whole borough. It places the SS18 land in Landscape Character Area J1, Langdon Lower Hill Slopes, and rates it "Very high" susceptibility and high sensitivity to large to very large scale housing (Table 48, page 113). Its capacity assessment of the cluster containing these sites finds sensitivities "medium to very high", highest beside the SSSI and ancient woodland (Cluster 20, page 185).
Policy SS18 cites the study once, in criterion 4, for the "landscape integration opportunities" it lists. Neither the policy nor its explanation records the study's finding on sensitivity, the site selection recorded landscape "for information" with no weight (section 4.1), and no document in the evidence base reconciles a "Very high" susceptibility rating with an allocation of 5,000 homes on the land so rated.
The 2023 IIA scored the land significant negative on soils, resources, water, flood risk and landscape (Appendices Table G.15, page 488), said it "prevents Stanford le Hope and Langdon from merging" (G.366, page 493) and warned of "disturbance and damage" to the SSSI (paragraph 4.75, page 149). The Council's 2022 Horndon on the Hill charrette [62] recorded of this land that it had been "submitted speculatively, no assessments have been done" and that "there are no existing facilities". Four years on, the assessments that observation called for have still not been done: there is no ecological survey, no flood model, no drainage strategy, no noise assessment, no provider confirmation and no site-specific viability test (section 4.6), and the land has gone from "submitted speculatively" in 2022 to an allocation of 5,000 homes on about 250 hectares of Green Belt in 2026 on the same absence of evidence.
No reasons for overriding any of this are recorded. The plan does not cite the Green Belt assessment in any allocation policy. It does not mention the heritage rating. It does not explain the reversal of the HLAA's finding on Corringham Park Farm. It sets an affordable housing requirement above what its viability evidence supports. A plan that departs from its own commissioned evidence on Green Belt, housing land, heritage and viability, for the same site, without stated reasons, is not "based on proportionate evidence".
4.3 Ground J3: left out twice, reinstated on an unpublished claim
The sequence is in section 3.2 and is repeated here because it goes to the justified test directly. The 2023 appraisal ranked the two-new-towns option fifth of six and the Council chose an option without Lower Langdon. The 2026 appraisal's preferred strategy "did not take forward Lower Langdon" because "West Horndon represented the stronger strategic option". The site was "brought back into consideration because of the increased housing requirement being tested" and on the promoter's "demonstration" of delivery to the plan's timeframe (IIA [8] paragraph 2.61).
Neither reason survives the Council's own later evidence. The increased requirement is a choice the Council made, not a need (section 4.5). The promoter's demonstration has never been published, and the Council's viability consultants [29], who met the promoters on 21 May 2026, record: that the promoters engaged with the Council through a planning performance agreement in 2023 and "discussions have since stalled" (paragraph 8.63), that "no site-specific viability testing has been undertaken" because the promoters returned no figures (paragraph 8.64), that "it was not expected that the site could contribute to housing delivery in the first 5 years of the plan" (paragraph 8.67), that one landowner "has total control of the site" and the promoters "are seeking a development partner for delivery" (paragraph 8.68), and that the promoters' assurance of viability at 50 per cent affordable was "on the assumption that the emerging policy requirements and infrastructure contributions were not too onerous" (paragraph 8.69). Section 5.3 shows that the infrastructure the site needs is £256.6 million on the Council's own count, that the items the count leaves out add £20 million to £80 million more, and that every line of it is assigned to developer contributions with no other funder named.
The Cabinet Member told members on 26 August that there were "commitments from developers". For this site the record shows a stalled promoter, no development partner and an unpublished claim.
The IIA records generally that "discussions with site promoters/site owners/house builders helped to filter out sites that weren't deliverable in the long term and influence which Spatial Options got discounted" (paragraph 2.57) and that the preferred option aligned with "sites where there was greater confidence in long-term deliverability as confirmed in discussions with site promoters" (paragraph 2.59). The IDP [30] records that the allocations were "prepared by Thurrock Council officers in early 2026", before the viability consultants met the promoter in May and reported in June. A site reinstated on a promoter's word, where the promoter's later recorded position is that the site will not deliver in the first five years, is not a site selected on proportionate evidence.
The record therefore shows a filter applied in two ways. Every other site was sifted on the published methodology and the IIA's spatial options. This one, having failed both, was brought back late on a test the methodology does not contain, confidence in deliverability expressed by its own promoter, and on a higher housing target the Council had itself chosen. No document records that the same confidence test was applied to the sites that were left out, or that the promoter's demonstration was ever examined against the site's own constraints.
4.4 Ground J4: the capacity figure was written to a target and does not close
The Lower Langdon Site Specific Assessment [14] (Arup, 7 July 2026) produces the 4,041-dwelling figure on which the 4,000-home allocation rests. Its brief is stated in its own text: "It is assumed that this site, having been identified by TC, is considered developable" (section 9.2.1; "TC" is Thurrock Council). "This figure must demonstrate capacity exceeding the 4,000-dwelling target" (section 5.4.1).
The study was instructed to assume developability and to exceed a number. It found 4,041, a margin of one per cent on 225 hectares.
The capacity was predetermined, not calculated: the target came first and the study was asked to reach it. Its density assumptions are stated as 30 to 70 dwellings per hectare in one section and 30 to 100 in another.
For Corringham Park Farm the same study finds (section 5.4.2) that 1,000 homes "would require medium-density development typology ... with limited provision of amenities, open space and green infrastructure. This approach falls below best-practice standards, and would be unlikely to support the creation of healthy and sustainable communities", and that the best-practice capacity is 463 dwellings.
The policy allocates 1,000 and makes the parcel the first phase, carrying "the early movement network, utilities and community facilities" and "the first components of the SANG" for the whole settlement. The study's suggested remedy, that Lower Langdon "accommodate the Corringham Park Farm housing deficit", would push Parcel a to about 4,578 homes on land tested to 4,041.
So the Council's own consultants found that 463 homes is what the parcel can take to a proper standard with its infrastructure. The Council more than doubled that figure without any modelling or stated reason, and then also loaded the first components of the SANG onto the same 29.4 hectares.
Natural England's standard for a SANG, applied to every other housing scheme beside this SSSI, is 8 hectares for every 1,000 new residents [138]: 1,000 homes at the IDP's own 2.4 people a home means about 19 hectares of SANG, two thirds of the parcel, before a single home, road or school is placed. On the study's own figures the 1,000 homes already take the whole parcel. With the SANG they require, Corringham Park Farm would have to be about 1.7 times its actual size.
The land budget does not close. The study's land use split gives 6.4 hectares for all non-residential uses on the gross developable area of 160.40 hectares. Policy SS18 requires 20 hectares of employment land alone, two primary schools and an all-through school, approximately 32 hectares of open space, 20 Traveller pitches and a Suitable Alternative Natural Greenspace (SANG) that has no area, location, cost or delivery body anywhere in the plan or the Infrastructure Delivery Plan [30]. Reconciling the shortfalls from the residential area at the study's average of about 45 dwellings per hectare removes in the order of 1,500 to 1,900 homes before any SANG land is found.
The capacity study's constraints map records "no other protected areas" on a site bounded by a SSSI and containing two Local Wildlife Sites. The Environment Agency's Flood Map [91] (May 2026) places about 16 per cent of the site in Flood Zones 2 and 3. The study leaves those zones out of its developable area with 10 and 15 metre setbacks, but no document says where the functional floodplain, Zone 3b, lies, because that needs the modelling the Council's own flood assessment calls for and nobody has done, and the drainage ponds the site needs would have to sit on the same low ground. The study's figure accounts for none of it. The school land figures use the Essex Design Guide benchmarks (section 4.4). The Council has not published a land budget reconciliation.
The independent land budget made for this representation does that reconciliation on the Council's own numbers. Starting from the Council's own capacity of 3,841 homes (3,378 at Lower Langdon in its housing land study, 463 at Corringham Park Farm in its consultants' best-practice figure) and setting aside only the land its own drainage policy, its own ancient woodland and SSSI buffers and Natural England's greenspace standard require, the homes that can reasonably be built across Lower Langdon and Corringham Park Farm fall to 2,126, and the affordable housing the site can support falls from the Council's 34 per cent to none (the reduced capacity below; section 5.2; Appendices I and J).
Table 4.4a. The two parcels, in the Council's own figures.
Parameter |
Lower Langdon (Parcel a) |
Corringham Park Farm (Parcel b) |
|---|---|---|
Site area |
225.29 ha |
29.39 ha |
Gross developable area |
160.40 ha (71 per cent) |
25.74 ha (88 per cent) |
Net residential area |
90.20 ha |
not stated |
Council target |
4,000 |
1,000 |
Consultant's tested capacity |
4,041 (about 45 dwellings per net hectare) |
1,066 at the Council's density, with biodiversity 2 per cent, drainage 2 per cent, community facilities nil; 463 at best practice |
HLAA [38] capacity, October 2025 |
3,378 (site 60940, suitable) |
nil (site 60893, "Unsuitable") |
Infrastructure Delivery Plan cost |
£256,596,000 on the IDP's own summary (Tables 13-3, 13-4), for 4,000 homes; all "Developer Contributions" |
none |
Designations in or adjoining |
Fell-me-down Shaw (ancient woodland, confirmed by Natural England 25 September 2026) and Lodge Hall Shaw (Ancient Woodland Inventory application being prepared on the same evidence), both Local Wildlife Sites; priority habitat; a statutory Main River; Flood Zones 2, 3 and 3b; "Former Works – Basildon" contaminated land; Langdon Ridge SSSI on the northern boundary |
Langdon Ridge SSSI (CS-11's "inner edge is aligned with" it); elevation to 60 metres |
[Arup Site Specific Assessment Tables 5-3 and 5-4; HLAA Appendices [15]; IDP Schedule Part 2 [31]] |
The land budget proposed by the Council. The capacity study's land use split for Lower Langdon, applied to its 160.40 developable hectares, is:
-
residential plots, 56 per cent (89.8 ha).
-
non-residential uses (education, leisure, retail, employment), 4 per cent (6.4 ha).
-
roads, 15 per cent (24.1 ha).
-
public open space, 10 per cent (16.0 ha).
-
biodiversity, 4 per cent (6.4 ha): the study's allowance for habitat inside the layout. It is not a SANG. The study provides no SANG at all.
-
sustainable drainage, 4 per cent (6.4 ha).
-
community facilities, 5 per cent (8.0 ha).
-
other infrastructure, 2 per cent (3.2 ha).
Against that budget Policy SS18 actually requires:
-
approximately 20 hectares of employment land (the whole non-residential allowance is 6.4 ha).
-
two primary schools and one all-through school (about 14 to 16 ha on Essex Design Guide benchmarks, from the same 6.4 ha).
-
approximately 32 hectares of open space plus 1.2 hectares of allotments (the budget provides 16.0 ha here and about 2.6 ha at Corringham Park Farm, about 14 ha short).
-
20 serviced Gypsy and Traveller pitches (about 1.5 to 2 ha, not provided for).
-
a district centre, neighbourhood parades, healthcare and community facilities (within 8.0 ha).
-
a SANG sufficient to divert recreational pressure from the SSSI (on the standard Natural England applies in Thurrock and Basildon, "8ha/1000 new population", which it calls "a robust standard" [138], about 96 ha; the budget provides none).
-
biodiversity net gain habitat (undetermined because no baseline exists, while the budget provides 6.4 ha).
Employment land alone exceeds the entire non-residential allowance three times over before a school is sited. Reconciling the identified shortfalls from the residential area at 45 dwellings per hectare removes in the order of 1,500 to 1,900 homes. Include any meaningful SANG and the 4,000 figure cannot stand. Even with the whole of the capacity study's 10 per cent open space counted towards it, which favours the Council because ordinary open space is not normally accepted as SANG, Natural England's standard needs about 42 hectares more land on the Council's own capacity of 3,841 homes, and about 27 hectares more on the 2,734 homes that fit once the constraints are applied (Appendix I).
No workable land budget has been proposed by the Council. On the capacity study's own figures a land budget cannot close: employment land alone is three times the non-residential allowance, the open space is about 14 hectares short, and a SANG of any meaningful size has no land at all. A land budget drawn up now, on the Council's own numbers, would record that shortfall in the Council's own words.
The constraints the capacity study left out. This paragraph maps what the study left out. The next re-derives the number of homes once it is drawn on the land.
The Council's study made no allowance for a SANG, allowed 6.4 hectares for drainage where the national standard needs 19 to 25, drew no buffer to the SSSI or to the ancient woodland beyond 15 metres, and counts the green corridors of its own layout inside the developable area. Intersecting the Council's own HLAA parcel polygons with Natural England's SSSI units, the Ancient Woodland Inventory, the Local Wildlife Sites layer and the Environment Agency's flood data gives the constraints the study did not map.
Parcel a shares about 350 metres of boundary with the SSSI and has 24.6 hectares within 250 metres of it, 10.7 per cent in Flood Zone 3 and 16.8 per cent (about 38 hectares) in the future flood extent, 0.98 km of Main River, and the whole parcel in Source Protection Zone 3.
Parcel b shares about 1,075 metres, its whole northern edge, with the SSSI: 21 per cent of it lies within 50 metres, 43 per cent within 100 metres and 91 per cent within 250 metres. The capacity study's gross developable area already leaves out Flood Zones 2 and 3, with setbacks of 10 and 15 metres, and all woodland with 15 metres (Site Specific Assessment [14] sections 5.2.2 to 5.2.4 and Table 5-1, PDF page 22). The climate change flood extent adds only about 0.2 hectares beyond that.
An earlier version of this analysis deducted the flood extent again and is withdrawn. The capacity figures in this representation deduct only land the study did not already leave out (the reduced capacity below; Appendix I).
Reduced housing capacity, on the Council's own figures. The independent land budget made for this representation starts from the Council's own capacity figures, not the consultants' 4,041, and deducts one constraint at a time, counting only land that the Council's own policies, its own consultees and Natural England's published standard require and that the capacity study did not already leave out. The homes that remain at each step are the figures carried into the viability analysis at section 5.2. The full method, data and limits are at Appendix I, and the drainage analysis at Appendix O.
-
The Council's own capacity: 3,841 homes. 3,378 at Lower Langdon (HLAA [15], PDF page 37) and the consultants' own best-practice figure of 463 at Corringham Park Farm [14]: 1,159 below the policy's 5,000 before any constraint is applied.
-
Drainage land: 3,223 homes. The capacity study allows 4 per cent of Lower Langdon's developable land, about 6.4 hectares, for sustainable drainage. The independent drainage analysis made for this representation, which models the rainfall falling on the site and sizes the storage the national standard named in the Council's own Policy DMP29 requires, finds that Lower Langdon needs about 19 to 25 hectares of drainage land with ponds at the Essex safe depth of 1.2 metres (13 to 19 if 2-metre ponds are allowed) and Corringham Park Farm 3 to 4 (Figure 1; Appendix O). Taking 20 hectares at Lower Langdon and 4.6 at Corringham Park Farm reduces the homes to 3,223.
-
Fell-me-down Shaw buffer: 3,085 homes. A 50-metre buffer to Fell-me-down Shaw, which Natural England concluded on 25 September 2026 meets the criteria for ancient woodland.
-
SSSI buffer: 2,911 homes. A 50-metre buffer to Langdon Ridge SSSI.
-
Lodge Hall Shaw buffer: 2,861 homes. A 50-metre buffer to Lodge Hall Shaw, for which an application to the Ancient Woodland Inventory is being prepared on the same evidence as Fell-me-down Shaw (a survey of the wood by the author in October 2026 found a mature oak and ash canopy throughout).
-
A13 noise bund: 2,734 homes. If the A13's noise is dealt with by an earth bund and fence, which the plan does not provide for, the bund takes a 22-metre strip along the road edge of both parcels (Appendix Q; Figures 2 and 3).
-
SANG to Natural England's standard: 2,126 homes. If the SSSI is protected to Natural England's standard of 8 hectares of SANG per 1,000 new residents, at 2.4 people a home (the IDP's own occupancy) and with the capacity study's 10 per cent open space counted towards it, a further 27.2 hectares is needed (25.1 at Lower Langdon, 2.1 at Corringham Park Farm). The plan provides neither the land nor the SANG (Figure 2, panel 4).
Each step removes homes in proportion to the land it takes. These are estimates, not layouts, and the buffer widths are sensitivities, not claimed standards (confidence C4 on the five-point scale explained at the start of Volume 2).
Simply put, once every constraint that the Council's own policies require is counted, SS18 is unviable on the number of homes it can deliver. Carried through the Council's own viability appraisals (section 5.2; Appendix J), the affordable housing the site can support falls with the homes.
Table 4.4b. The land budget, step by step: the homes that remain and the most affordable housing the land can carry after each constraint the Council's own documents require.
Constraint applied, cumulatively |
Homes |
Most affordable housing the site can carry, on the Council's own land price test |
|---|---|---|
Policy as written |
5,000 |
34 per cent (the Council's own figure, below the plan's 35) |
Council's own capacity |
3,841 |
17 per cent |
Drainage land the national standard needs |
3,223 |
5 per cent |
Fell-me-down Shaw buffer |
3,085 |
2 per cent |
SSSI buffer |
2,911 |
none |
Lodge Hall Shaw buffer |
2,861 |
none |
A13 noise bund and fence |
2,734 |
none; land £51 million to £56 million short at 35 per cent |
SANG to Natural England's standard |
2,126 |
none; land £95 million to £102 million short at 35 per cent |
The cost of the drainage works and their maintenance, and of the bund and fence (£2.7 million to £6.5 million), is not in these capacity figures. It is set out in section 5.3 and Appendices J and Q, and lowers every figure further. Figure 6 in section 5.2 charts the fall in affordable housing step by step.
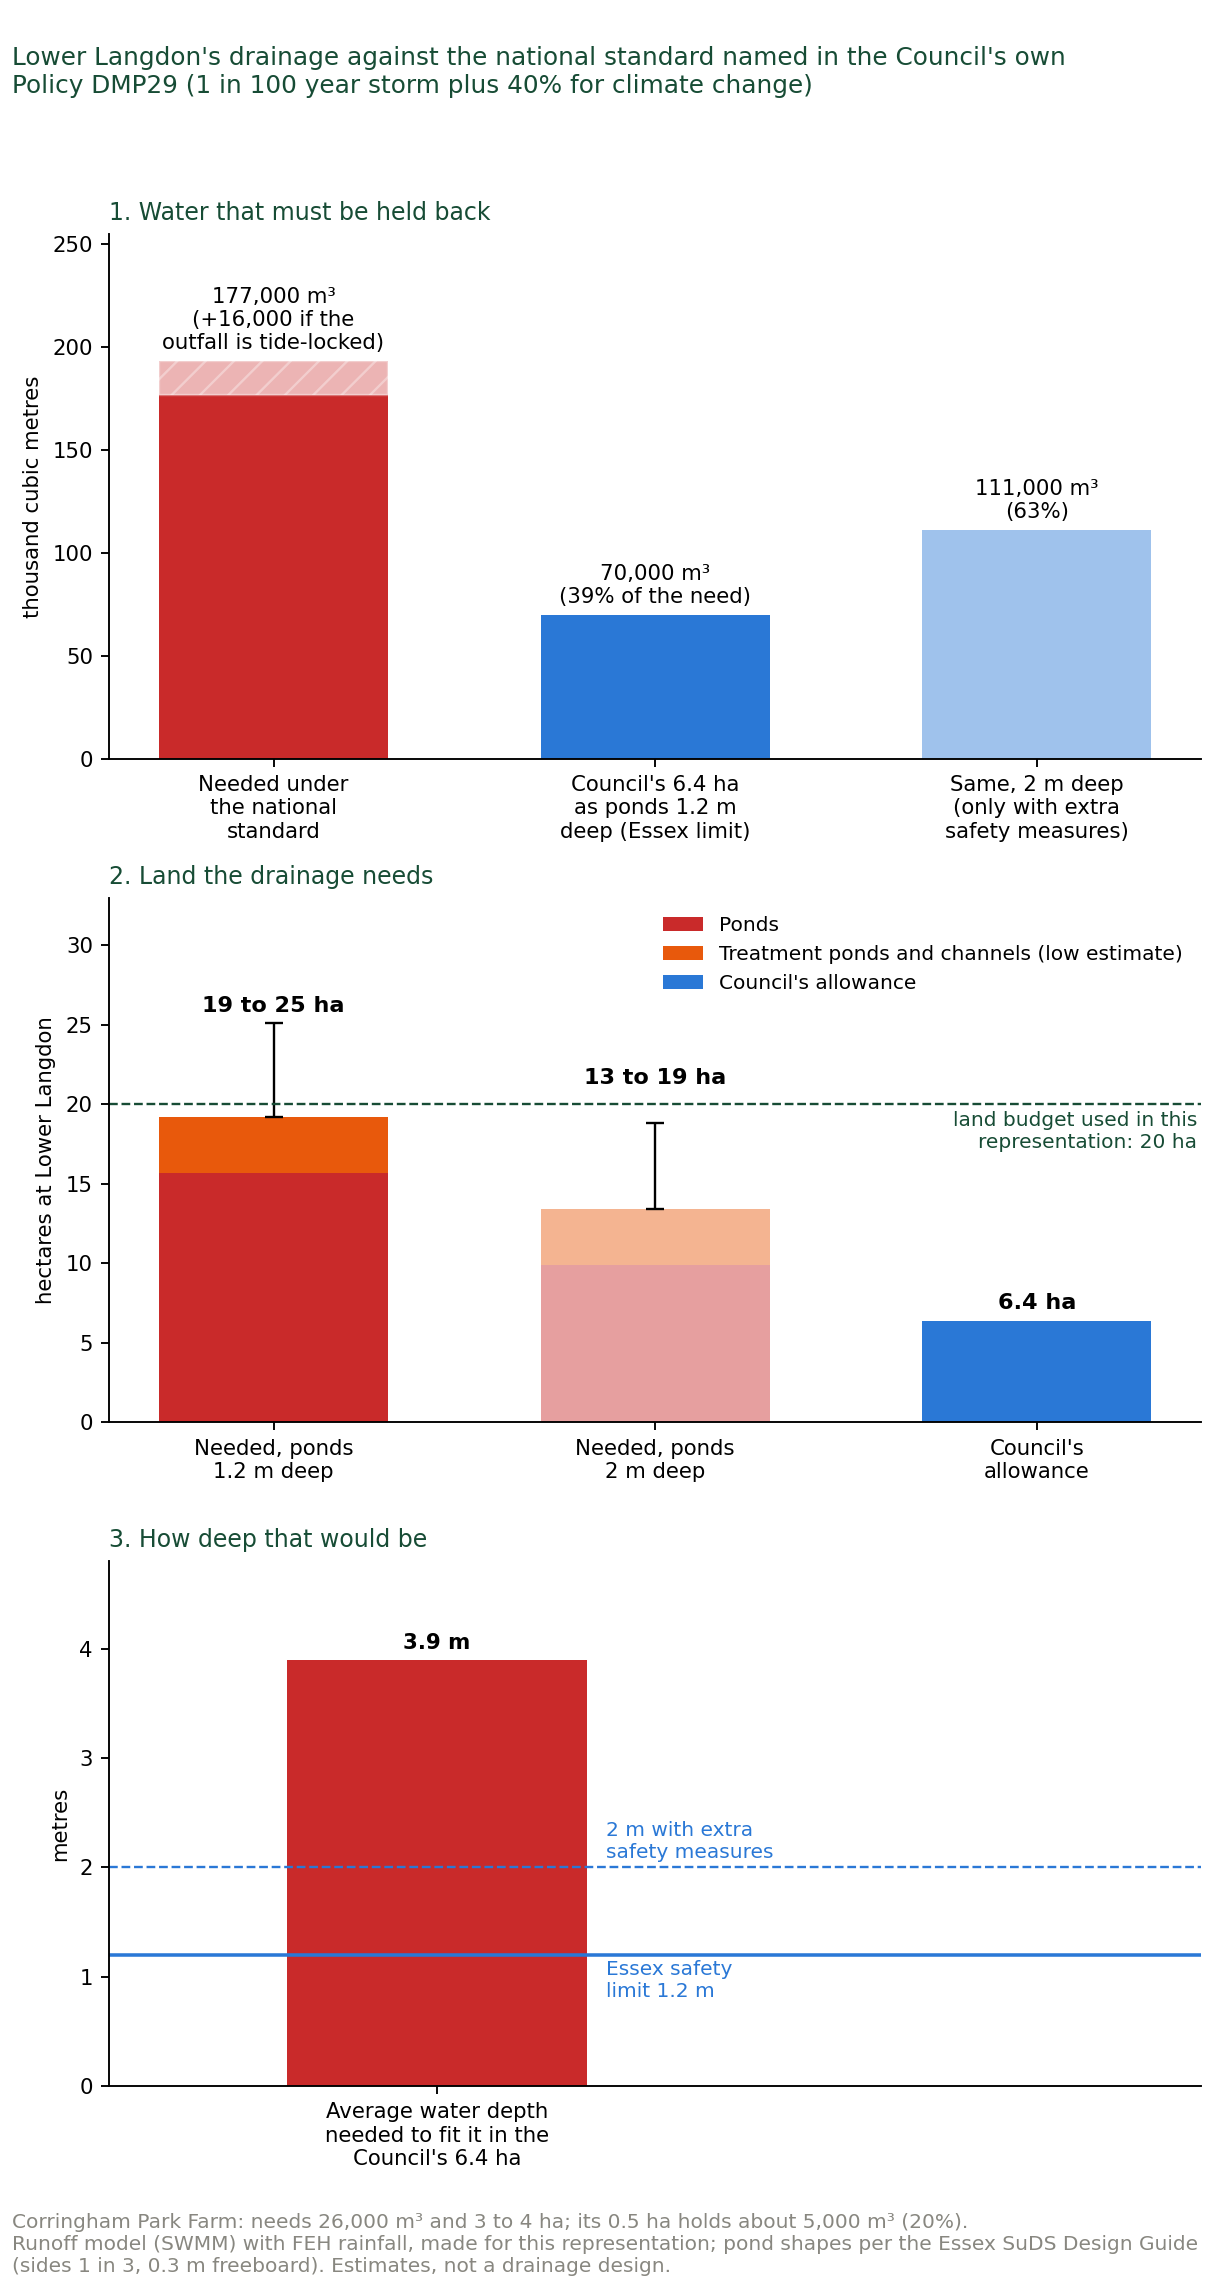
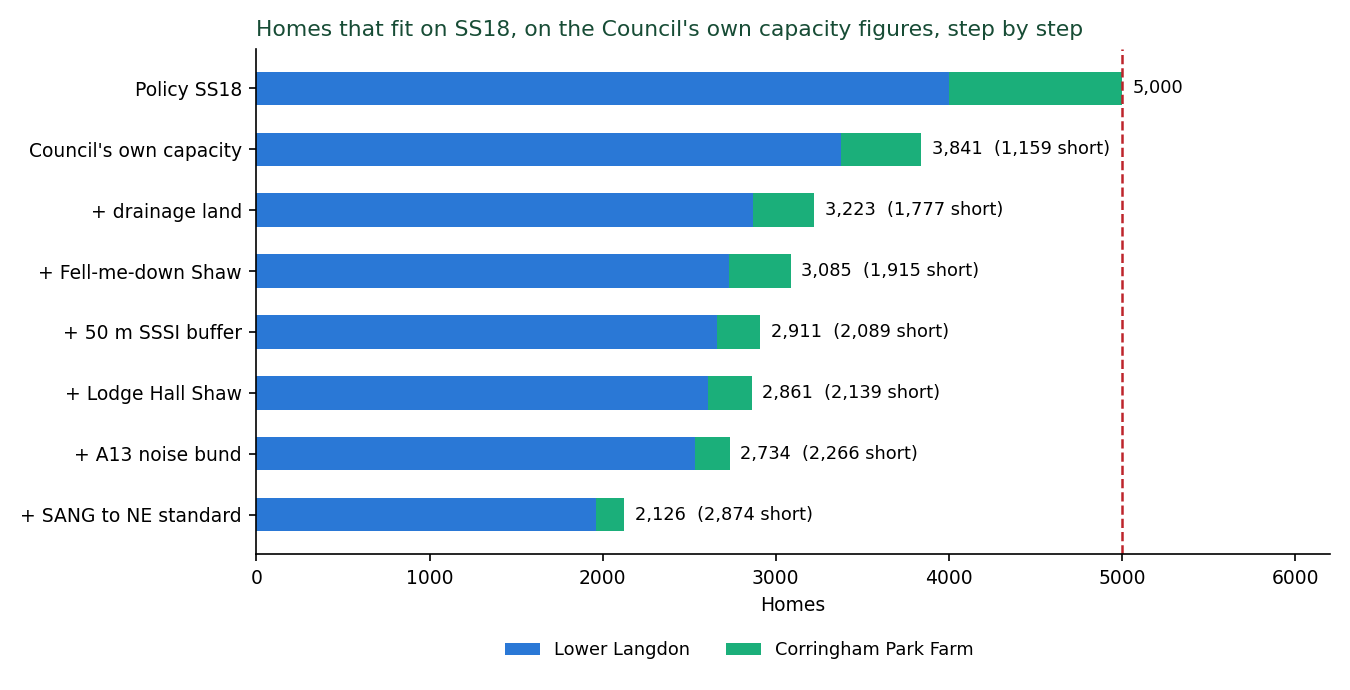
At the last step 2,126 homes remain, no affordable housing is viable, and the land is £95 million to £102 million short at the plan's 35 per cent (table above; section 5.2, Figure 6). The cost of the drainage works and their maintenance and of the bund and fence is on top (section 5.3; Appendices J and Q).
4.5 Ground J5: the housing need does not require SS18, and the plan cannot accurately state its own figures
Four minimums. The standard method housing minimum appears as 21,480 in the plan (paragraphs 4.2.2 and 4.2.24), 21,540 in the Cabinet report [4] (Table 4), 21,450 in the IIA [8] (paragraphs 2.62 and 2.64) and 21,420 to 21,540 in the Housing Needs Assessment [41] (HNA). The Council adopted 28,880, "approximately 34%" above the minimum (paragraph 4.2.3), choosing the "High Growth" scenario over a "Medium Growth" alternative of 23,680 that was before Cabinet (Cabinet report Table 4, paragraph 5.2).
Two totals. Paragraph 4.2.3 (page 34) says the plan is "planning for 35,906 homes over the plan period". Table 2 (page 43) gives "Total Supply 2024-2044" as 25,406 and "Strategic Site Allocations delivering beyond Plan Period" as 10,500.
The plan's supply within its own period is 3,474 homes below its own requirement. The Infrastructure Delivery Plan [30] uses a third total, 33,727, with 12,200 beyond 2044 (IDP page 402 and Table 2-1). The buffer is "approximately 14%" at paragraph 4.2.3 and "+24%" at paragraph 4.2.26 (page 46) and in Table 2.
The uplift is a choice, not a need. The 28,880 rests on the Economic Development Needs Assessment [42]'s "higher growth" jobs scenario of 1,558 jobs a year (31,166 over twenty years), which is the independent Oxford Economics (OE) baseline of 729 a year "adjusted" upward sector by sector on "discussions with Freeport landholders" (EDNA paragraphs 4.30 to 4.33, Table 4.9): ports and logistics from 0.9 to 2.25 per cent a year, "between two and three times the OE projected growth rate". Construction from 1.5 to 2 per cent on "construction of Freeport and recently approved LTC [Lower Thames Crossing]", temporary jobs used to size permanent homes.
The HNA converts the jobs to homes on the assumption that they are filled by people living in the borough (paragraph 4.19) using a commuting ratio from a census year the consultant itself calls "skewed" by the pandemic.
The HNA states that "it would not be necessary for the Council to set a housing requirement higher than the outcome of the standard method if it was to target only the baseline level of job growth forecast" (paragraph 4.9), that housing at the standard method "could enable" about 20,009 jobs (paragraph 4.5), and that 1,444 homes a year "could be needed ... if it chooses to target such levels of job creation" (paragraph 4.20). The jobs figure in Policy SP03, 16,975, is the office, industrial and warehouse component only. The 31,166 to which the homes were sized appears nowhere in the plan.
The delivery record. The HNA records that Thurrock has delivered more than 1,000 homes in a year once since 2001 (1,209 in 2004/05), that the 2018 to 2024 average is about 413, and that 1,444 a year is "nearly a fifth (19%) more than have been delivered in any single year since at least 2001" (paragraphs 4.15, 4.20).
The plan's Appendix 2 assumes about 170 homes from all strategic allocations between 2024 and 2029, then 5,350, 7,260 and 6,450 in the following five-year bands: 1,600 to 1,700 a year for fifteen years, with no delivery vehicle in place (Policy SS18 paragraph 9: the Council "will consider using a delivery vehicle"). The plan's first five years deliver 1,457 homes against a requirement of 7,220.
The national record. The Government's own statistics settle whether the rate is credible: whether Thurrock, or any council, has ever built at the rate the Council has chosen [112] [118]. MHCLG Live Table 122 records 11,465 net additional dwellings in Thurrock in the 24 years 2001-02 to 2024-25, 478 a year, 1,080 in 2004-05, the only year above 1,000 (the HNA's 1,209 is a gross completions figure), a best ten-year average of 567 (2011-12 to 2020-21), and 380 a year over the last five years. Over the last ten years, 2015-16 to 2024-25, it added 5,414 homes, 541 a year: the requirement the Council has chosen is 2.7 times what the borough has actually built in the past decade, and the standard method minimum alone is already twice it (Appendix H, Figure H1).
The requirement of 1,444 houses a year is 2.5 times the borough's best decade, every year for twenty years. 28,880 homes in 20 years is more than two and a half times the last 24.
Relative to the borough's size (70,871 dwellings in 2025, Live Table 125), 1,444 a year is 2.04 per cent growth a year, taking the stock up by 41 per cent in twenty years, twice its proportional growth in the last 24.
Across all 298 English councils with a complete twenty-year series, only four have sustained 2.04 per cent over any twenty-year run since 2001, and two of those are the City of London (5,500 dwellings) and East Lindsey (whose series is a statistical artefact): in substance, Tower Hamlets and South Derbyshire. Over ten-year runs it is 11 of 326.
No council in Essex, and none of Medway, Dartford, Gravesham or Havering, has ever built 1,444 homes in a single year. Barking and Dagenham did so once, in 2024-25. The best ten-year averages in South Essex are Colchester 974 and Chelmsford 914. Basildon's is 531.
There is no evidence that Thurrock, or any comparable council, has the capacity to build the number of homes the plan forecasts at the rate it forecasts them. (Appendix H)
The record of jobs against homes. The Council's own argument is that the borough will gain jobs and therefore needs homes for the people who fill them: the Housing Needs Assessment converts the higher growth scenario into 1,444 homes a year on the assumption that the new jobs are filled by people living in Thurrock, holding the 2021 commuting pattern constant (HNA, paragraph 4.19), and the plan adopts that figure.
The borough's own record over the last ten years tests that assumption directly, because the jobs growth the plan assumes for the next twenty has already happened once.
Office for National Statistics (ONS) Business Register and Employment Survey (BRES) data for Thurrock [110] show total employment rising from 65,000 in 2015 to 80,000 in 2024, about 15,000 jobs, 1,670 a year, more than the 1,558 a year the Council's Economic Development Needs Assessment (EDNA) higher growth scenario assumes.
Of the 15,000, 9,000 are in one division, warehousing and support activities for transportation, and 5,000 of those arrived in a single year, 2019 to 2020. Retail lost 4,000. Over the same nine years the borough added 5,101 net additional dwellings, about 567 a year (Live Table 122 [112]).
The Council's assumption is not supported by its own data.
The last decade shows jobs growth at the plan's assumed rate accommodated with about two fifths of the homes the HNA says it requires (567 a year against 1,444), about 2.9 jobs for every net additional home against the HNA's 1.08.
Simply put, a large share of the people who work in Thurrock live outside it and commute in, and there is no direct relationship in the borough's own record between the number of jobs and the number of homes required. The HNA does not model in-commuting at all. It assumes that everyone who takes a new job in Thurrock will live in Thurrock.
Applying the relationship actually observed over the Council's own last ten years of data to the HNA's own 31,166 forecast jobs gives a housing response in the order of 10,600 homes required in Thurrock over twenty years, not 28,880.
That figure is not this representation's forecast of need, which the Government's standard method fixes at 21,480. It is the Council's own method run on the Council's own record, showing that the conversion from jobs to homes on which the 28,880 rests is unsupported by the only evidence that tests it.
On manufacturing, which the EDNA raises from Oxford Economics' minus 1.7 per cent to plus 5 per cent a year, BRES records 2,645 jobs in 2015, 3,335 in 2019 and 3,070 in 2024: 1.7 per cent a year over the decade and a decline since 2019. 5 per cent a year has no precedent in the record.
For completeness: transport and storage grew faster than 2.25 per cent a year over the decade, so the EDNA's adjustment to that sector is not attacked on precedent. The point is that the jobs it forecasts have, on the borough's own record, not required the homes the plan attaches to them. (Appendix G)
The density the forecast assumes, against what the one Freeport site already built has actually delivered. The Council's Economic Development Needs Assessment (EDNA, prepared for the Council by its consultants) raised the transport and storage growth rate on the basis that the Freeport sites "have capacity to deliver substantially more jobs" than the independent forecast, and that "over 20,000 jobs could be accommodated on the available Freeport Sites" (Table 4.9). That capacity is computed at the 2015 Employment Density Guide ratio, now eleven years old, of 73.5 square metres of warehouse floorspace per full-time job.
London Gateway is the Freeport site with a record. Its owner reported on 12 March 2025 that the 2013 Local Development Order produced "17 state-of-the-art facilities for 16 occupiers, totalling more than 4.0 million sq. ft and creating 1,500 permanent jobs onsite" [111]: 371,612 square metres, one job per 248 square metres, about a third of the density the Council's ratio assumes. The Council's own monitoring (EDNA 4.48) records 328,578 square metres completed at London Gateway since 2013/14. At the Council's ratio that floorspace would hold about 4,500 jobs. The Business Register and Employment Survey for 2024 records 4,000 jobs of every kind, container terminal included, in the whole statistical area containing the port and park, of which 1,750 are warehousing [110]. The undeveloped half of the park would support about 1,700 jobs at its own observed density against about 5,700 at the Council's.
The Freeport jobs in the Council's higher growth scenario are sized to a density that the Freeport's own flagship site has already disproved.
The consequence for SS18 is direct. The whole uplift above the Government minimum, 28,880 less 21,480, is 7,400 homes over twenty years, and SS18's 3,400 homes in the period sit inside it.
Replace the Council's density with the density its flagship Freeport site has actually achieved and the Freeport jobs fall by about two thirds. Replace its conversion of 1.08 jobs a home with the 2.9 the borough's own record shows and the homes those jobs require fall by about two thirds again. On either correction, and still more on both, the homes the Freeport jobs would require are far fewer than the 17,055 homes of suitable, available and achievable capacity the Council's own housing land study holds and the plan does not allocate (section 7.1; Appendix N).
Even on the Council's own assumption that jobs require homes, and even accepting that SS18 exists to house Freeport workers, the number of homes the Freeport requires at SS18 is nil. (Appendix G)
Why this matters for SS18. The IIA says the site came back "because of the increased housing requirement being tested". The requirement is a self-set target 34 per cent above need, on a forecast no body outside the Council has validated, that the plan does not meet within its period with or without SS18, and that has no precedent in the borough's delivery. The Council created the circumstance it then called exceptional.
The Freeport tax reliefs that underpin the higher growth scenario expire on 30 September 2031 [123]. On the plan's trajectory SS18's first homes come in 2029/30 and reach 600 by 2033/34, after the reliefs expire, and on the promoter's account none arrive in the first five years from adoption (to about 2033), so the homes justified by the Freeport arrive after its reliefs have ended (timeline, Map B6). No neighbouring authority has asked Thurrock to meet its need, and the plan claims to meet none. The only neighbour that welcomed Lower Langdon, Southend, did so as a place for its own shortfall (section 5.5). Without SS18 the plan exceeds the Government minimum.
None of the evidence that would be needed to justify an uplift above the standard method exists: no independent validation of the jobs scenario, no sensitivity test under the baseline or mid-growth scenarios, no commuting analysis that does not fix the 2021 ratio, and no single consistent statement of the requirement, the minimum and the buffer.
Against the borough's own record (15,000 jobs with 5,101 homes), London Gateway's own density (one job per 248 square metres) and the national record (two councils in England have sustained the rate), no evidence could now support 28,880 homes needed in Thurrock. The uplift, and with it the reason given for SS18, is not justified. (HNA [41]; EDNA [42])
4.6 Ground J6: the evidence does not exist
Ecology. No biodiversity survey of any kind has been carried out on the site: no habitat survey, no protected species survey, no breeding or wintering bird survey, no bat, reptile, amphibian, badger, invertebrate, botanical, tree or hedgerow survey. The IIA [8] Appendices [9] record that biodiversity effects "cannot be determined at this strategic level of assessment" (paragraphs D.40 to D.41).
The policy defers all survey to the masterplan. The site adjoins Langdon Ridge SSSI, whose notified features are species-rich neutral grassland, fen meadows, ancient and long-established semi-natural woodland, two invertebrate assemblages (open short sward and scrub-heath) and Deptford pink, a plant classified as Endangered in England, which the citation records in "the grasslands in the southern part of Langdon Ridge" [138]. Natural England's supporting information names it as a feature of units 22, 31 and 35, and gives its colonies at Old Hill (unit 22, on the allocation's northern edge), at Hawkesbury Bush, beside Corringham Park Farm, and at Bells Hill. At Hawkesbury about twelve plants were present in 2016 [23] [138] [139]. Its supporting information also records breeding nightingale, turtle dove and lesser spotted woodpecker in its scrub and woodland.
Natural England's register records "Recreational Disturbance" as an active pressure on the SSSI since 12 September 2019, the only pressure recorded, and the SSSI is 80.5 per cent "unfavourable recovering".
Four of the SSSI's eleven favourable-condition units lie in its southern arm, along the allocation's northern edge. All four are lowland neutral grassland, the nutrient-limited habitat most sensitive to trampling and dog fouling. No visitor survey, catchment analysis or carrying-capacity study [14] exists.
The SANG on which the policy's mitigation depends has no area, location, cost or delivery body.
The Council has no record of what lives on these fields. The people who live beside them do. Residents' records over many years, at Appendix D, put on the SS18 land itself adder, grass snake, brown hare, badgers foraging daily from the SSSI's woodland units, skylark in good numbers across both parcels, and barn owl and little owl hunting along the boundary. Lesser spotted woodpecker nests in the shaws, including Fell-me-down Shaw, and golden plover, lapwing and curlew move between the estuary and the fields in winter.
Several are Red List birds, several are species of principal importance under section 41, and adder, badger and the bats are legally protected. None is mentioned in any Council document. The species list is at Appendix D. [Natural England Designated Sites View [88], Langdon Ridge SSSI S2000857, retrieved 1 September 2026; IIA Appendices D.40 to D.41, C.213]
What Natural England has required of every other housing scheme near the SSSI, and which SS18 does not provide. Natural England's advice on the housing applications around Langdon Ridge since 2024, released under the Environmental Information Regulations (EIR) [138], applies one consistent standard, and SS18 meets none of it.
For 2,100 homes at West Horndon, about 2.5 km away, it advised that without mitigation the scheme would "damage or destroy the interest features" of Langdon Ridge SSSI, and required a financial contribution to fund visitor access management and monitoring (6 November 2024).
For 375 homes at Mandeville Way, Laindon, it asked for a "Cumulative impact assessment of proposed new housing on Langdon Ridge SSSI", advising that such an assessment be carried out "for residential applications affecting Langdon Ridge SSSI as non-significant residual impacts from individual applications may add up to a significant effect" (27 May 2025), and later gave the same "damage or destroy" advice for that scheme (3 December 2025).
For 300 homes at Vange it advised that the SSSI "may be at capacity", and the mitigation agreed with Thurrock Council, which manages the nearest part of the SSSI, was a financial contribution towards Langdon Ridge secured by a section 106 agreement (1 September 2025).
For 320 and 412 homes at Corringham, in Thurrock, it named Langdon Ridge as within "easy walking and/or driving distance" with features "sensitive to recreational pressure" (June and October 2025).
For the West Horndon promoter it recorded, from its own officers responsible for the site, that "recreational pressure is currently an issue" at Langdon Ridge, "causing trampling/loss of sensitive vegetation, dog-worrying of grazing livestock, and 'urban' effects such as litter, bonfires etc." (16 July 2024), and noted that the 3,700-home Dunton Hills scheme was required to give about half its 225 hectares to green and blue infrastructure. SS18 places 5,000 homes against the SSSI's southern boundary with no visitor assessment, no cumulative assessment, no costed access management and no land set aside for it, while the policy itself encourages walking routes from the settlement into the SSSI and the access the Infrastructure Delivery Plan costs would send hundreds of vehicles a day through the narrow ancient lanes that run inside and along it (section 5.4).
The Council may say that these are matters for the application stage. They are not. The SSSI is a legally protected entity, the protection of which is the responsibility of the Council, not a housing developer targeting financial profit. What the plan does is settle the principle of building 5,000 homes on land inside the SSSI's Impact Risk Zone, on no ecological data at all. The standard Natural England applies to a 300-home application a kilometre away cannot be set aside for an allocation seventeen times the size on the boundary itself, and a site whose effects on the SSSI are considered only after the decision to build on it has been taken has not been assessed at all.
The SSSI's condition units along the boundary, which no Council document identifies: four of its eleven favourable units, and three still recovering. Langdon Ridge SSSI (345.09 hectares, notified 29 June 2018, confirmed 21 March 2019) has 35 monitoring units: 11 favourable (about 67.3 ha) and 24 unfavourable recovering (about 277.8 ha).
The southern arm, along the allocation's northern edge, comprises units 022 (Old Hill and Great Sutton Wood, 14.04 ha, woodland, unfavourable recovering), 023 (14.40 ha, lowland neutral grassland, favourable), 024 (24.57 ha, woodland, unfavourable recovering), 025 (3.93 ha, neutral grassland, unfavourable recovering), 026 (6.08 ha, neutral grassland, favourable), 027 (3.31 ha, neutral grassland, favourable) and 028 (4.25 ha, neutral grassland, favourable).
Four of the SSSI's eleven favourable units lie on this boundary, all lowland neutral grassland: the nutrient-limited habitat that supports the notified short-sward invertebrate assemblage and on whose south-facing slopes the Deptford pink depends, and the habitat most sensitive to trampling and dog fouling. No Council document identifies this. Ten of Natural England's Impact Risk Zone polygons overlap the allocation.
Table 4.6. The species the Council ignored, one by one. What the statutory and county record shows in the adjoining SSSI, and what residents record on the SS18 land itself, against what the Council surveyed for the allocation:
Species or habitat |
Status |
Recorded by Natural England or Essex Wildlife Trust in the SSSI |
Surveyed by the Council for SS18 |
|---|---|---|---|
Nightingale, lesser spotted woodpecker (also nests in Fell-me-down Shaw, inside the allocation), turtle dove |
Red List; section 41; turtle dove globally Vulnerable |
Yes |
No |
Woodcock |
Red List |
Yes (Essex Wildlife Trust) |
No |
Bullfinch, nuthatch, treecreeper, tawny owl; barn owl and little owl hunt along the boundary and feed on the SS18 land |
Amber and Green List |
Yes |
No |
Badger and setts; badgers forage daily on the SS18 land |
Protection of Badgers Act 1992 |
Yes (Essex Wildlife Trust) |
No |
Bats, all species |
European Protected Species |
On the Council's own priority list |
No |
Great crested newt |
European Protected Species |
Yes (Essex Wildlife Trust) |
No |
Adder, grass snake (adder recorded on the SS18 land) |
Section 41; WCA Schedule 5 |
On the Council's own priority list |
No |
Brown hare (on the SS18 land), hedgehog, water vole |
Section 41 |
On the Council's own priority list |
No |
Skylark (good populations across all the SS18 land) |
Red List; section 41 |
On the Council's own priority list |
No |
Grizzled skipper, white admiral, brown-banded carder bee |
Section 41; SSSI notified features |
Yes |
No |
Invertebrate assemblages F112 and F003; thin weblet spider, Cryptocephalus bilineatus, Dicraeus tibialis |
SSSI notified features; nationally scarce |
Yes (2014 and 2017 surveys) |
No |
Deptford pink |
Schedule 8; Endangered in England; SSSI notified feature; native population at Old Hill |
Yes |
No |
Sulphur clover, green-winged orchid, adder's-tongue |
Nationally scarce or notable |
Yes |
No |
Fen meadow, groundwater-dependent |
SSSI notified feature |
Yes |
No hydrogeological assessment exists |
The Council's own Thurrock priority species list includes bats, adder, grass snake, brown hare, hedgehog, water vole and skylark.
Not one protected species is named in connection with the allocation. The constraints map the settlement was designed on records "no other protected areas" within the site, "no overlap between the heritage areas and the housing sites", no Local Wildlife Sites (because only Natural England datasets were used and the sites are a local designation), no contaminated land, and only Flood Zones 2 and 3 from national mapping. The IIA (6.431, 6.432), Policy SS18 and the Level 2 SFRA record a SSSI on the boundary, two Local Wildlife Sites inside, heritage assets within the boundary, a contaminated land designation and functional floodplain. The plan's own policy also requires the retention of a "Streamside Wood Biodiversity Area of Local Interest" that appears in no register.
The evidence base proceeds as if the arable fields were empty: as if nothing bred or foraged on them, as if the SSSI's badgers, adders, owls and bats stopped at its boundary fence, and as if 5,000 homes with their lighting, noise, traffic, cats and dogs could be built up to that boundary without effect on what lives on either side of it. The one woodland the study treated as an ordinary 15-metre setback, Fell-me-down Shaw, is now confirmed ancient woodland, irreplaceable under the Framework. The land budget rebuild applies a 50-metre buffer to it (Appendix I).
The Impact Risk Zone. Every part of the allocation lies inside Natural England's Impact Risk Zone (IRZ) for Langdon Ridge SSSI. Natural England confirmed to me in writing on 17 September 2026 (Consultations Hub [89] reference 558703) that the IRZ is the tool a local planning authority is expected to use to decide whether a proposal is likely to affect a SSSI. The Site Selection Methodology [37] does not mention Impact Risk Zones. No published document applies the IRZ to SS18.
What lies inside it is set out above: four of the SSSI's eleven favourable grassland units along the boundary, the Deptford pink colony at Old Hill, badgers, owls and bats that forage from the SSSI's woodland over the allocated fields, Red List birds breeding and wintering on the fields themselves, and, inside the allocation, Fell-me-down Shaw, now confirmed ancient woodland. On the evidence in this section, building 5,000 homes on this land would do serious and, for the ancient woodland and the notified grassland, irreversible harm to the SSSI. The Council has not examined that risk, and it cannot be examined for the first time at a planning application once the land has been allocated.
Flood. The Level 2 Strategic Flood Risk Assessment [34] (AECOM, February 2026) is marked "WORKING DOCUMENT / NOT YET APPROVED FOR ISSUE", is Revision 01 "Draft Report", refers to a plan period "up to 2040" and to "Section X", and cites the July 2021 NPPF. Its published file is fifteen pages. The site proformas (Appendix B) and borough mapping (Appendix A) are not in it.
For site 60940 it records: "Development is not permitted in Flood Zone 3b. This area should be retained as floodplain. Detailed modelling should be undertaken to determine the risk of flooding from the Main River and associated ordinary watercourses and the design flood levels for the site. Development should be located outside the design flood extent."
No modelling has been done. About 0.98 kilometres of Horndon Brook, a statutory Main River for which the Environment Agency is the operating authority, runs through the site to the A13.
The Environment Agency was not consulted on the allocation: asked for any record of consultation on SS18 before its inclusion in the Regulation 19 plan, it replied on 9 October 2026 that it holds none (Appendix E, item E7; [148]).
The Flood Risk Sequential Test [35] (July 2026) records site 60940 as Flood Zone "3B" and passes the exception test by stating that the site has been allocated and that "planning applications ... will need to provide project level Flood Risk Assessment": the first limb is met by restating the allocation and the second is deferred.
The Environment Agency's Flood Zones plus Climate Change dataset (March 2025) places about 17 per cent of the site in the future flood extent. The Level 2 assessment does not use it. The whole Lower Langdon parcel lies in groundwater Source Protection Zone 3. (Level 2 SFRA (draft) [34]; Flood Risk Sequential Test [35], PDF pages 4, 8, 9, 11).
What the Agency did say, at Regulation 18 on 6 February 2024, was that the Lower Langdon land carries ordinary watercourses and surface water flow paths that "should be avoided by built development", that the land beside the A13 "has a high level of surface water flood risk", that development must "ensure that risk to others is not increased" in Corringham and Stanford-le-Hope downstream, and that "the new SFRA (currently in progress) should look to provide evidence base to support the consideration of this potential site". It expected the updated assessment "to inform the allocation of land" (Agency response AE/2023/129077, pages 2 to 3 and 23; [148]).
The assessment that was to provide that evidence is the unapproved draft above, with no model of the site in it. The Agency has now supplied to us the modelled levels and flows for the Main River through the site from its own Stanford 2016 model, and confirmed that the site "does not benefit from any Environment Agency maintained assets". The Council's evidence base contains none of this data.
Set against that data, this representation's runoff model agrees with the Agency's for the brook as it is today (4.8 against 4.6 cubic metres a second at the A13 in the 1 in 100 year storm), and shows the built site without full attenuation sending the brook five to eight times the Agency's 1 in 100 year flow, more than its modelled 1 in 1,000 year flow. The Agency's own model also puts the 1 in 100 year water level at the A13 1.1 metres higher with its upper climate change allowance, on a floodplain the capacity study sets housing back from by 15 metres.
The model files the Agency supplied show something more basic: its detailed model covers the town and stops at the A13, taking in 4.5 of the parcel's 225 hectares. The Flood Zones drawn across the site come from the Agency's broad-scale national model, which it describes as a high-level tool needing further assessment before it is used for development.
There is no detailed flood model of this land, the Council's own assessment says one should be made, and nobody has made one (Appendix O, result 2A, Table O6 and Figure O6).
This representation's flood modelling, in plain English. Because the Council has no flood model, one was built for this representation in the professional modelling software the Environment Agency and the drainage industry themselves use, the US Environmental Protection Agency's Storm Water Management Model (EPA SWMM) 5 for rainfall and runoff and the US Army Corps of Engineers' Hydrologic Engineering Center River Analysis System (HEC-RAS) 7 for flooding across the ground in two dimensions, from national data: the Environment Agency's own 1-metre laser survey of the ground, its published flood maps, and the national design rainfall for the site bought from the Flood Estimation Handbook service (Appendix O).
Four things follow:
First, about 600 hectares of Langdon Ridge, nearly three times the site's own area, drains into Lower Langdon and leaves by a single outlet into Stanford Brook just above the A13. The site study makes no allowance for that water.
Second, built as the Council's consultants propose, the site would shed far more water than today's fields: in an ordinary storm about twice as much in the two-dimensional model and up to nine times as much in the runoff model, which treats roofs and roads separately. In a 1 in 100 year storm a quarter to a half more. The Environment Agency's own river model, released to this representation on 9 October 2026, gives the scale: today's 1 in 100 year flow in Stanford Brook at the A13 is 4.6 cubic metres a second, and this representation's model agrees (4.8). Built without full drainage, the site would send 24 to 36, more than the Agency's modelled 1 in 1,000 year flow.
Third, the Council's own drainage policy (DMP29) requires the national standard, under which Lower Langdon must hold back about 177,000 cubic metres of water in the design storm, a figure calculated in the runoff model from the national design rainfall for the 1 in 100 year storm plus 40 per cent for climate change, held back to the greenfield rate the standard requires (Appendix O, Table O3). The 6.4 hectares allowed by the Council holds about 70,000 as ponds within the Essex safety limits, and its ponds would have to average about 4 metres deep to hold the rest, more than three times the 1.2 metres that Essex's own sustainable drainage guidance sets as the safe depth for open ponds, so the Council's allowance cannot meet its own standard on the land it gives it. Built as allowed, they fill about 12 hours into the design storm and send about 107,000 cubic metres straight into Stanford Brook, at up to 20 times the permitted rate and nearly twice what the fields send today.
Fourth, the Environment Agency's surface water map shows about 19 hectares of the land the consultants would build on at Lower Langdon, and 6.5 hectares at Corringham Park Farm, at risk of surface water flooding today. The plan has asked none of these questions, and its own drainage rule cannot be met on the land it set aside (Appendices I and O).
The drainage allowance breaks the Council's own policy. Policy DMP29 requires drainage to "Achieve greenfield runoff rates (as set out in national standards for SuDs)" (page 341). The national standards (Defra, June 2025) [141] say that where a site sheds more water once built, as SS18 does (66,000 cubic metres as fields, 101,000 built, in the 1 in 100 year, 6-hour storm), water may leave it in a 1 in 100 year storm only at the fields' ordinary yearly flood rate, 0.76 cubic metres a second for Lower Langdon, with the upper climate allowance (40 per cent here). Drainage ponds may not sit on land at 1 in 100 year flood risk.
Think of a bath: building turns the tap up, the standard keeps the plughole small, so the bath must be big. On this representation's runoff model Lower Langdon needs about 177,000 cubic metres of storage, about 70 Olympic swimming pools (193,000 if the outfall is shut by the tide). The Council's 6.4 hectares, built as ponds within the limits the Essex flood authority next door applies (water no deeper than 1.2 metres, or 2 metres with extra safety measures; sides no steeper than 1 in 3), holds about 70,000, 39 per cent of the need. To hold it all its ponds would have to average about 3.9 metres deep (Figure 1).
The Government's national SuDS standard, which the Council's own Policy DMP29 adopts, needs 19 to 25 hectares of drainage land at Lower Langdon (13 to 19 with 2-metre ponds) and 3 to 4 at Corringham Park Farm, whose 0.5 hectares holds about a fifth of its need. Some of the natural pond sites are at 1 in 100 year flood risk, where ponds are not allowed, so they must move onto land the Council counts for housing (Appendix O, Figures O4 and O5). The Council allows only 6.4 hectares where the official data shows that Lower Langdon requires 19 to 25 hectares of drainage land.
This matters now, not at the planning application: the 5,000 homes, the land budget and the viability all assume 6.4 hectares of drainage, and on the Council's own policy that land cannot do the job the plan gives it. Essex County Council is stricter still: it does not accept the fields' average flood rate and asks for the lower rate of the flood that comes about once a year.
These are model estimates, not an engineering design. Underground tanks or permeable paving could save land, but at many times the cost on a site that is already unviable, and the standard expects attenuation at several points across the site.
Thurrock, not Essex, is the flood authority here. The Essex guide is used for pond shapes and as a comparator. (Appendix O, Table O5)
Water, sewerage and ground. There is no sewer to the site: the Council's own Water Cycle Study Scoping Report [43] (March 2024, 6.1.3) says "There is no existing sewer network in some locations to connect into including Fobbing, Langdon Hills, Lower Langdon and West Horndon, therefore new infrastructure would be required in these areas".
The IDP's reassurance on connection costs is limited to developments "close to existing settlements, where wastewater infrastructure is already established" (page 75). Lower Langdon is neither, and the IDP's Lower Langdon schedule contains no sewer, pumping or wastewater item.
The only treatment capacity test ever made (WCS Table 6-1) assessed three growth options. The highest put 4,000 homes at Lower Langdon, none at Corringham Park Farm and 5,000 at West Horndon, and found Tilbury WRC's residual headroom falling to 485 homes at today's water use of 150 litres a head a day, rising to 6,836 or 10,689 only if every new home uses 122 or 110.
That result describes a distribution the plan did not adopt and is not the plan's headroom. It shows only that the works approaches its permitted limit under high growth unless water use falls by about a quarter.
The detailed Water Cycle Study the scoping report said was needed, and promised at Regulation 18, has never been produced. The Environment Agency's own records show the works' inlet overflow already spilling 64 times a year for lack of "Hydraulic capacity" (section 3.1) [115]. Essex & Suffolk Water "noted concern over the ability of treatment works to meet the wastewater demands of new developments in Thurrock" (IDP page 76). The borough-wide water cost in the IDP [30] is "Unknown" (Table 13-3, page 176). The scoping report treats the Mardyke as Thurrock's only Water Framework Directive catchment, never addressing the brooks south of Langdon Ridge, so no receiving water body for the site's drainage is identified.
Natural England said at Regulation 18 (IP0173) that there was "no evidence that measures to address surface water run off south of Langdon Ridge can be achieved". The Council's own 2023 appraisal attributed part of Stanford-le-Hope's flooding to run-off from the site. No drainage strategy exists.
The whole Lower Langdon parcel is in groundwater Source Protection Zone 3 and the site text (page 289) names a "Former Works – Basildon" contaminated land designation that appears in no policy requirement, no HLAA [38] record and no site score, with infiltration drainage proposed over it. No agricultural land classification survey has been done. Natural England's provisional map shows 97.5 per cent Grade 3 and about 5.4 hectares of Grade 2, best and most versatile land, and no post-1988 detailed survey covers any part of the site [121]. The appraisal scores soils significant negative with and without mitigation. Anglian Water confirms that it has made no capacity check for the site and that the detailed Water Cycle Study has not been published (12 October 2026).
Farmland and food. Lower Langdon is working arable land, and no Council document records what it grows or what building on it would cost in food. The Rural Payments Agency's Crop Map of England, a satellite classification of every 0.4-hectare patch of farmland, shows wheat on 101, 157, 61 and 105 hectares of the 225-hectare parcel in 2021 to 2024, 106 hectares in an average year, with barley, oilseed rape, beans, peas and maize on most of the rest: 152 to 197 hectares were cropped each year, and 204 hectares were in wheat at least once in the four years (Figure 3A) [142].
At England's wheat yield of 7.0 tonnes a hectare in 2025, the lowest since 2020, and the UK's 8.6 tonnes in 2022, an average year's wheat is about 740 to 910 tonnes, lost for good. Corringham Park Farm is grass in all four years and is not counted. The plan itself names "avoiding the loss of productive agricultural land" as one of its challenges (paragraph 2.4.28, page 24) and "Pressure on greenfield and agricultural land from housing" as a risk (paragraph 2.4.22, page 23). Its appraisal notes that "Best and most versatile land is important for food growing" and then records only a "loss of Grade 3 agricultural soils" (IIA [8] paragraph 4.76). National policy asks plans to recognise the benefits of best and most versatile land and, where significant development of agricultural land is necessary, to prefer poorer land (NPPF December 2024 [74], paragraphs 187(b) and 188, footnote 65). Whether any of the 209 hectares of Grade 3 is best and most versatile (3a) cannot be known because the Council never had it surveyed (section 4.1; [121]). Continuous cereal cropping is consistent with good land but does not prove it.
On its own the national effect is small, well under a hundredth of one per cent of England's wheat, and this representation does not rest on food security. The point is that the Council took 225 hectares of productive arable land out of the Green Belt for homes the plan does not need, without measuring what it produces or the grade of the land. (Working note on farmland and food production, held in the evidence repository, available on request.)
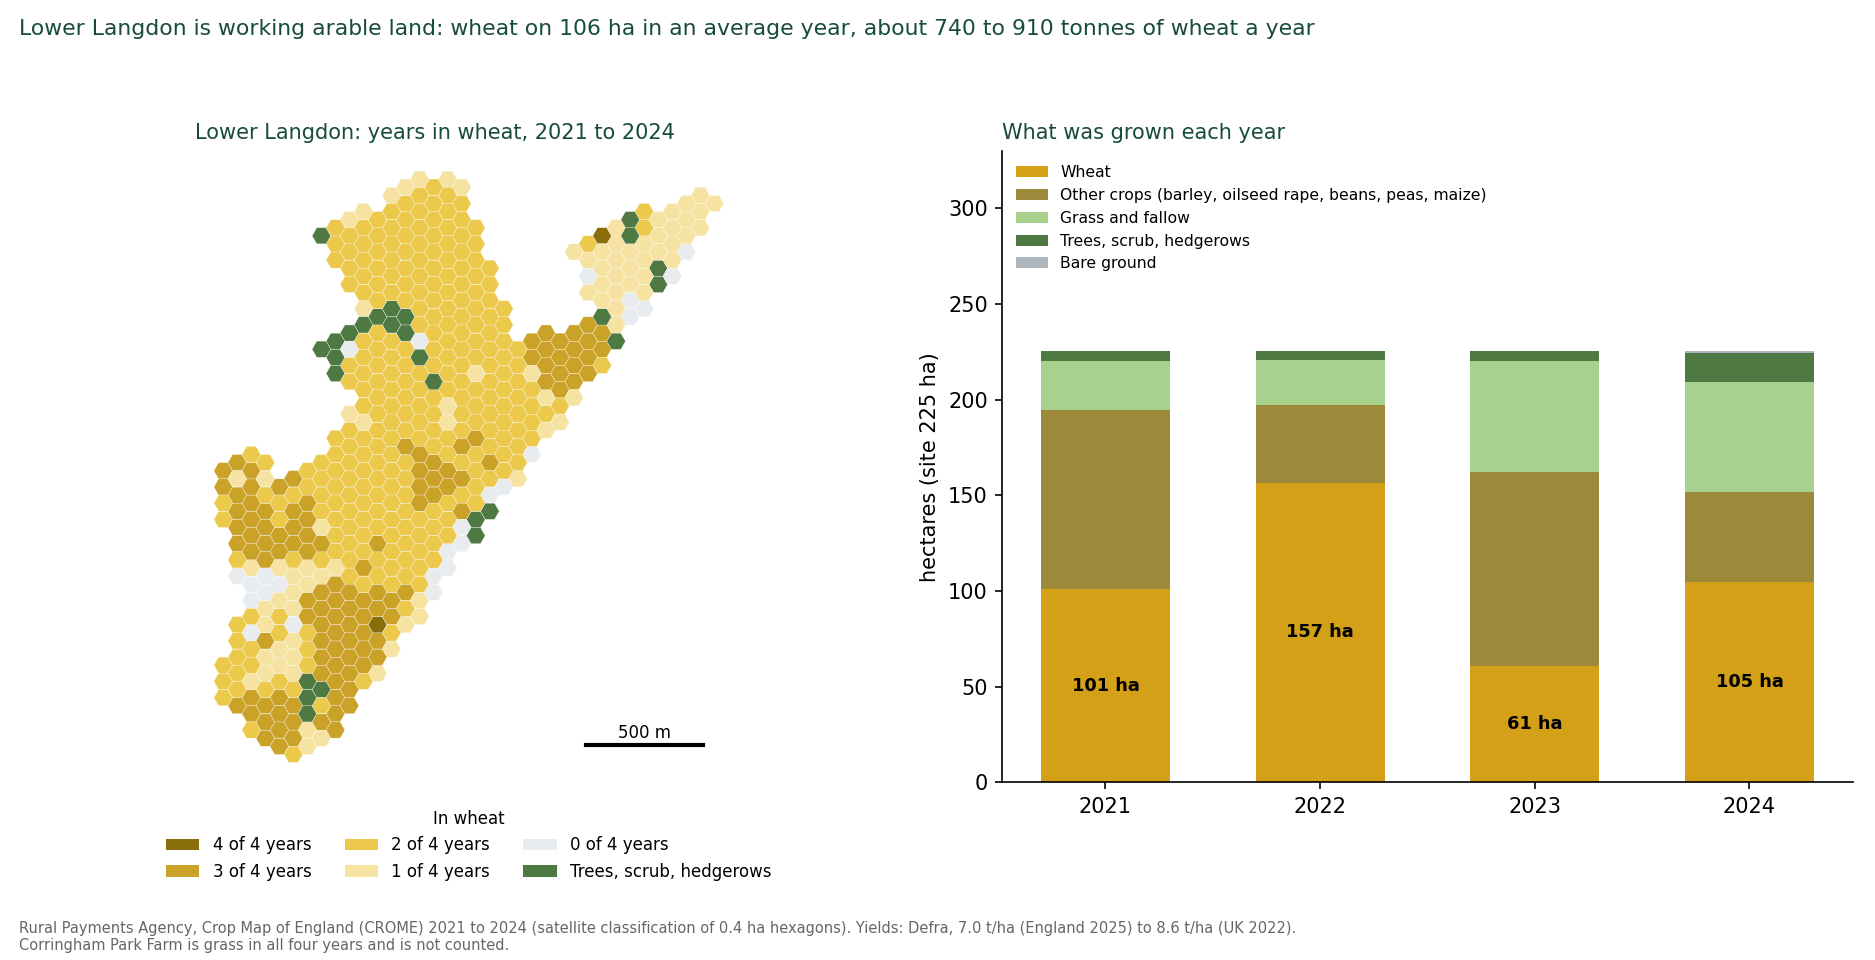
Sites the policy promises to enhance and the evidence never assessed. Three Local Wildlife Sites lie inside the allocation [18]. In Parcel a, Fell-me-down Shaw (Th56, 4.2 hectares) and Lodge Hall Shaw (Th90, 1.1 hectares) are woodland strips, the first of which Natural England has since confirmed as ancient woodland (25 September 2026) and the second of which is the subject of an Ancient Woodland Inventory application being prepared on the same evidence, and which the register calls "a good match for Priority woodland habitat". Of Lodge Hall Shaw it says it "may benefit from the proximity of Northlands Wood, now part of the Langdon Ridge SSSI".
In Parcel b, Hawksbury Grasslands (Th66, 9.0 hectares) is two pastures "on the steep, southern slope of the Langdon ridge", whose species "conform to an MG5 grassland community that qualifies the site as Priority habitat". MG5 is the "nationally rare" grassland type for which the SSSI itself is notified (supporting information [23], section 2.1, page 10). Policy SS18 names the two shaws (part D.5, page 293) and not Hawksbury Grasslands. The policy's word for the shaws is "enhance", which commits to nothing an assessment has defined, and no assessment of any of the three sites exists. Grove House Wood Local Nature Reserve, a statutory reserve, is named as a receptor in the IIA (paragraph 4.80) and appears in neither the policy, the HRA [11] nor the constraints work. Biodiversity net gain is set at 10 per cent where the county's own evidence supports 20, with no baseline, on 4 per cent of the site.
The only site assessment draws the SSSI wrongly, and small. The Lower Langdon Site Specific Assessment [14] (Arup) is the only site-specific assessment of the allocation. Its constraints map (Figure 3-1, page 13) mis-classifies the SSSI.
It gives SSSIs, ancient woodland and priority habitat a colour each as though they were three separate kinds of land, when the SSSI is a legal designation that contains the other two. So most of the 345-hectare SSSI is coloured as ancient woodland or priority habitat, categories that carry a 15-metre setback rather than statutory protection, and only small patches of SSSI colour remain.
The land touching Lower Langdon's whole northern edge, SSSI unit 22, Old Hill and Great Sutton Wood, is coloured as woodland and habitat, not as SSSI. The map therefore shows a SSSI that looks small and distant and a boundary that looks like ordinary woodland. Figure 3B below redraws the same area from Natural England's own boundary. The words "Sites of Special Scientific Interest" appear once in its text, in its list of data. "Langdon Ridge" does not appear. It states that "constraints analysis focuses on the Lower Langdon housing site only" (page 13), leaving out Corringham Park Farm, the parcel with the longest shared boundary with the SSSI, which it nonetheless treats as 88 per cent developable (Table 5-5, page 21). Its setback table applies 15 metres to "Woodlands and Protected Habitats" and nothing to the SSSI boundary (Table 5-1, page 18). [132]
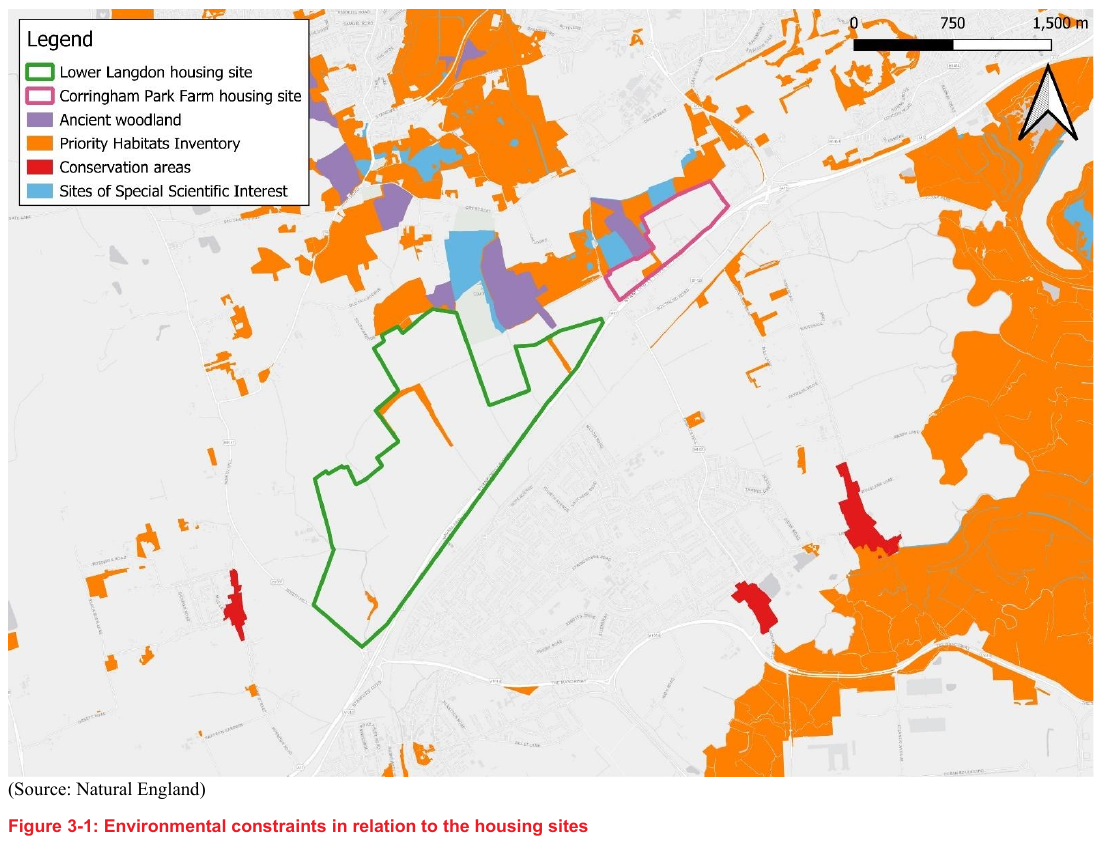
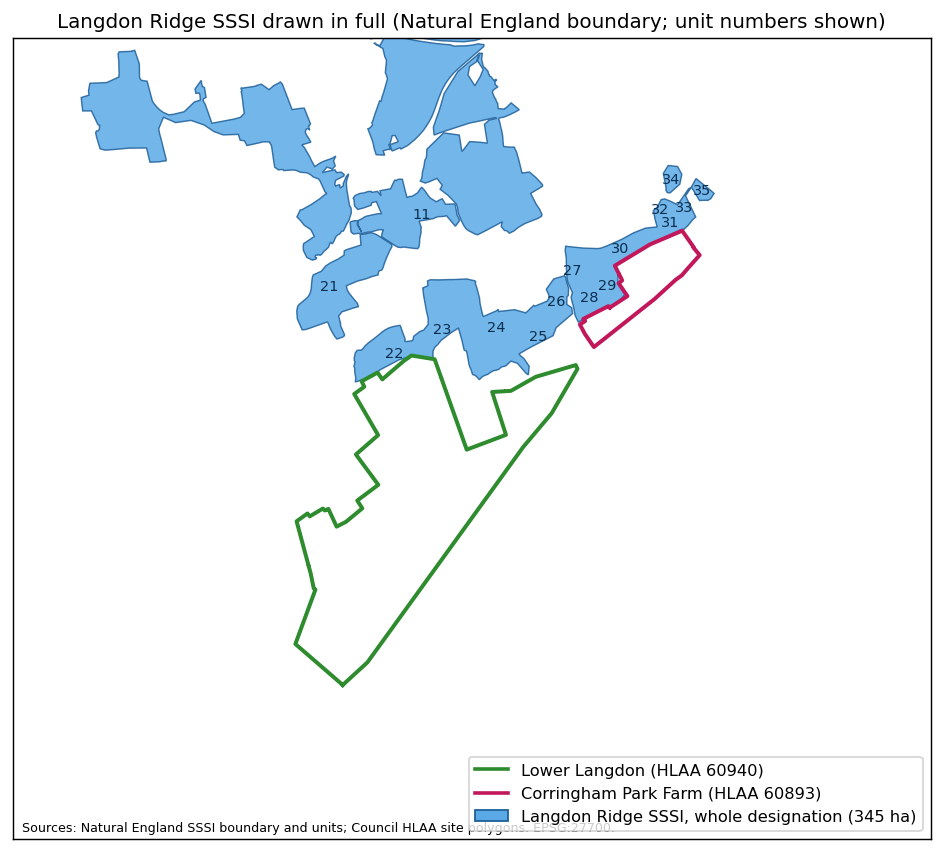
The policy, and the only layout drawn for it, send people into the SSSI the policy says it will protect. Policy SS18 requires a SANG "to account for extra recreational pressure on ... Langdon Ridge SSSI" (part A.1(g), page 292) and "to reduce recreational impacts on the Langdon Ridge SSSI" (part D.7, page 293). The site assessment [14] mentions no SANG and shows none.
Its concept plan (Figure 5-8, page 25) has no legend entry for the SSSI or ancient woodland, shows the woods as "Green Infrastructure / Corridors (including Natural and Amenity Open Spaces)", and runs "Biodiversity Corridor / Active Travel Route" arrows from the housing into them. The phasing plan builds those corridors first (Figure 5-12, page 29).
Arup describes the concept plan as "not intended for planning purposes" (page 25), but it is the only layout in the evidence base and the transport assessment was built on it. Most of its "green-blue network" is existing hedgerow, the two shaws, the watercourse and roadside trees along the A13. New habitat within the developable land is 4 per cent at Lower Langdon, about 6.4 hectares for 4,000 homes, and 2 per cent at Corringham Park Farm in the 1,000-home scenario (Tables 5-2 and 5-4, pages 20 and 21). The species recorded on this land, including skylark, brown hare, adder, owls, foraging bats and wintering birds (Appendix D), use the open fields, not strips of trees.
Recreational and pet pressure, quantified. A settlement of 5,000 homes at national ownership rates brings about 1,900 dogs and 1,800 cats (UK averages: 11.1 million dogs and 10.5 million cats, PDSA PAW Report 2025, over 28.6 million households, ONS 2024) to the boundary of a SSSI whose only recorded pressure is recreational disturbance and whose best-condition units are nutrient-limited grassland along that boundary.
Neither animal appears in any Council document. Domestic cats are the one predator a SANG cannot divert: they hunt from the garden fence, and the published estimate for Great Britain is of the order of 90 million prey items taken by cats in a single spring and summer, birds, small mammals, reptiles and amphibians among them (Woods, McDonald and Harris, Mammal Review, 2003) [144]. 1,800 cats along the SSSI's southern edge would hunt its scrub-nesting Red List birds, its reptiles and its small mammals every night of the year. Dogs carry a second harm the Council has not considered: their urine and faeces fertilise the ground they are walked on, and a study of peri-urban nature reserves measured the deposit at about 11 kilograms of nitrogen and 5 kilograms of phosphorus per hectare a year (De Frenne and Vangansbeke, Ecological Solutions and Evidence, 2022) [145], a load that the nutrient-poor grassland for which this SSSI is notified cannot absorb without losing the flora that defines it.
Where a SANG has been used as strategic mitigation elsewhere (the Thames Basin Heaths SPA) the working benchmark is about 8 hectares of accessible natural greenspace per 1,000 people, delivered before occupation, about 96 hectares for 12,000 people. Natural England applies the same standard to housing near Langdon Ridge, calling it "a robust standard" [138]. On the homes that actually fit it needs about 27 hectares more than the open space the capacity study already counts (Appendix I). That is this representation's estimate of the SANG the standard requires, an estimate the Council has not attempted. Policy SS18 provides 32 hectares of open space of all types and gives the SANG no area. The premise is untested: a greenspace on the flat arable below is unlikely to draw dog walkers away from ancient woodland at the end of every northern garden, and no visitor modelling, catchment analysis or example of a SANG protecting a woodland SSSI adjoining a settlement of this size has been offered.
Noise, light and air. No assessment of lighting, noise or air quality effects on the SSSI's bats, owls and invertebrates, or on existing residents, exists. Natural England's IRZ guidance [87] identifies development outside settlements that "will increase lighting levels" as a consultation trigger, noting that bats and birds "travel several kilometres from SSSIs to breed, roost, forage". Natural England told me on 17 September that light pollution is a matter for the Council (Appendix E1). Nothing has been considered.
The effects are not marginal. A settlement of 12,000 people places street lighting, lit gardens, car headlights and the glow of a town along the whole southern edge of a SSSI whose woodland units are dark today and whose bats, owls and moths depend on that darkness to hunt and to move between the units. Lit edges are known barriers to bats, and the SSSI's notified invertebrate assemblages include night-flying species drawn to light.
Construction noise for a decade and traffic noise thereafter would reach the breeding scrub of nightingale, turtle dove and lesser spotted woodpecker on the boundary. The remaining arable land around the settlement, where the skylark, hare, adder and wintering plover and lapwing recorded at Appendix D live, would be lit, walked, fenced and fragmented. None of this has been examined for a SSSI the Council has a statutory duty to further the conservation of (section 3.4).
Road noise on the homes themselves: the Council did not look. This representation did. The Government's own strategic noise maps [134], read across the site for this representation because the Council's evidence base contains no noise assessment of any kind, put 59 per cent of the allocation, 144 hectares, above the World Health Organization's recommended limits for road traffic noise by day and by night (Lden 53 dB, Lnight 45 dB), and 35 per cent above the British Standard's upper guideline for gardens (BS 8233, 55 dB). All of Corringham Park Farm, which the policy says will be built first, is above the WHO limits.
The plan has no noise evidence for the site and Policy SS18 no noise control requirement. The IIA [8] scores SS18 significant positive for health while noting the policy does not address noise (6.426). The Council's 2023 Initial Proposals said the A13 "will limit the developable area of the site as well trigger the need to consider ways to reduce the impact noise could have on future residents" (PDF page 152). The 2026 capacity study did not reduce the developable area, and the A13 buffer it draws is counted inside the 4 per cent of land set aside for habitat [14] (PDF pages 22, 24 to 27). No noise barrier, fence or bund is proposed, costed or given land.
The Council's own practice shows what is missing. The two estates it recently approved beside the A13 at Stanford-le-Hope, 127 homes off Stanford Road and 153 homes off The Manorway, each had a site noise survey and assessment, a review by the Council's Environmental Health officer and a planning condition requiring mitigation before anyone moved in [135]. On both, the Council's officers recorded that gardens would exceed the 55 dB guideline, and accepted it because the land was already allocated for housing. For the Stanford Road estate the committee report called it "negative harm" to be weighed in the planning balance.
The allocation is the stage at which that harm must be weighed for SS18, and it has not been.
The A13-facing edge of SS18 is also louder than either estate: a median of about 71 dB by day within 50 metres of the A13, against about 57 dB on the two estates. (Appendix Q)
Test engaged. Justified. National policy expects the evidence for a site allocation to be proportionate to the decision. For 250 hectares of Green Belt adjoining a SSSI, inside its IRZ and the estuary's zone of influence, containing functional floodplain and a Main River, the proportionate evidence is a records search, a season of survey, a flood model and an IRZ screening.
The site has been under consideration since 2023. None of that has been produced: no records search, no season of survey, no flood model and no Impact Risk Zone screening. Deferring all of it to the masterplan is the practice the Procedure Guide [77] describes as relying on later stages to "fix" a deficient plan (paragraph 1.1).
4.7 What the decision-makers were told on 26 August 2026
The Inspector will want to know on what basis the Council resolved to publish. The Cabinet report [4] and the recorded debate of 26 August 2026 contain the following statements, each set against the Council's own evidence. This is a record, not an allegation. The pattern it shows is haste and omission. (Cabinet report and minutes, 26 August 2026)
• "A substantial programme of evidence gathering has been completed." The flood assessment is marked "NOT YET APPROVED FOR ISSUE" with its site appendices unpublished. The HRA [11] does not mention the site. The IIA [8] never scored the adopted strategy. For this site there is no ecological survey, no flood model, no drainage strategy, no noise assessment, no landscape and visual assessment, no site-specific viability test, no land budget, no transport assessment of the access lanes, no statement of common ground with any body, no provider confirmation from the NHS, the rail operator, National Highways or either water company, no visitor or cumulative assessment for the SSSI, no Impact Risk Zone screening, no survey of the three Local Wildlife Sites inside it, and no record of the section 28G or section 40 duties being considered (section 4.6; the full list is at Appendix F, Tier 3 and Tier 4). "Substantial" describes the borough-wide evidence base. For the 250 hectares that SS18 allocates, the programme had not started.
• "Carefully assessed locations where boundary changes are necessary to meet future needs." The Council's Green Belt consultant assessed the SS18 land and wrote "Not recommended". The housing land study classed the first phase "Unsuitable". The plan gives no reason for departing from either.
• "The total supply is over 30,000." 10,500 of the 35,906 fall after 2044. Within the plan period supply is 25,406 against the Council's own 28,880. The first five years deliver 1,457 against 7,220. Members were not told the in-period shortfall.
• "If we didn't have the new towns, [there would be] a thousand in Stifford, a thousand in Ockendon, a thousand in Stanford." The Council's own option table gives the towns identical homes with or without Lower Langdon. The site only ever replaces 5,000 at West Horndon. The high-growth option without it exceeds the target. The statement also frames growth around the existing towns as the bad outcome to be avoided. The Council's own first-stage preferred strategy, chosen on its own appraisal, was the one without Lower Langdon, and the site came back only when the higher target was tested (IIA paragraph 2.61; section 4.3). What the Cabinet Member describes as the outcome to avoid is the delivery strategy the Council's own evidence preferred (IIA Table 2.2).
• "It strengthens protection for important environmental assets." 5,000 homes against the boundary of a SSSI, inside its Impact Risk Zone, against Natural England's Regulation 18 advice, with the habitats assessment silent on the site.
• "Have health, education, utility and transport providers confirmed capacity?" (asked twice). Not answered. None has.
• "The government cannot change this plan" (the answer to a member whose vote was conditional on it). The Inspector modifies plans. The Secretary of State directed Basildon on 21 July 2026. Resolution 2.4 the same evening delegated "any necessary changes" to an officer.
• "Commitments from developers." The SS18 promoter's discussions had "stalled". No site-specific viability testing. The delivery demonstration has never been published.
• "The plan has also benefited from advice from the planning inspectorate through two advisory visits" (said at Cabinet on 26 August 2026; the visits are recorded at Cabinet report paragraph 4.18).
Both visits (July and December 2025) predate the Green Belt assessment, the flood assessment, the viability assessment, the IIA, the HRA and the transport assessments. The evidence was published between 12 and 19 August 2026 for a decision on 26 August. The scope of the King's Counsel review (4.19) is unstated.
• The IDP [30] records that the allocations and employment sites were "prepared by Thurrock Council officers in early 2026" (IDP line 7254), before the viability, transport and habitats evidence existed.
• The IDP (July 2026), on which members relied for infrastructure, describes Basildon Hospital by a 2019 "good" rating. The Care Quality Commission had rated it inadequate, with conditions, nine months earlier [113]. It records water supply as sufficient only after "a significant reduction in per capita consumption", assumptions the same Council had told the water company in 2023 were "overly optimistic" [117].
5. Effective
The test: the plan must be "deliverable over the plan period, and based on effective joint working on cross-boundary strategic matters". For SS18 the Council's own evidence shows a site that cannot deliver on the trajectory the plan gives it, cannot fund the infrastructure the policy requires, and has been the subject of no recorded agreement with any provider or neighbouring authority.
5.1 Ground E1: the trajectory counts homes the promoter says will not come
The plan's Appendix 2 (page 415) has SS18 delivering 0 homes to 2028/29, 600 in 2029/30 to 2033/34, 1,300 in 2034/35 to 2038/39, 1,500 in 2039/40 to 2043/44 and 1,600 after the plan ends.
The Council expects adoption in 2028 and its five-year housing land supply will be measured from adoption against its own requirement of 1,444 homes a year (Policy SP05 criterion 10). The 600 homes fall inside that window.
The Council's viability consultants record the promoter's position in May 2026: the site "has the potential to deliver significant housing over the mid-to-long term. In this respect, it was not expected that the site could contribute to housing delivery in the first 5 years of the plan" (paragraph 8.67). Discussions with the Council "have since stalled" (8.63). No development partner is in place (8.68). The first five years of the plan run from adoption, expected in 2028, to 2033. All 600 of the homes the trajectory counts from SS18 in 2029/30 to 2033/34 fall inside the period in which the promoter says the site will deliver nothing. The promoter's own advice and the Council's trajectory cannot both be right. On any reading, the ground on which the site was reinstated, delivery "within a timeframe consistent with the key objectives and infrastructure milestones of the Plan", is unevidenced and, on the Council's later evidence, unsupported.
The NPPF (Annex 2) treats an allocation without planning permission as "deliverable" for the five-year supply only where there is clear evidence that completions will begin within five years, and as "developable" only where there is a reasonable prospect that it will be available and could be viably developed at the point envisaged.
Before any home is built on SS18 the policy requires a Council-approved masterplan, flood modelling that has not been done, ecological survey that has not been done, a SANG that is not specified, a delivery vehicle the Council "will consider", and a development partner the promoter is still seeking. There is no clear evidence of completions by 2033/34. The Corringham Park Farm parcel, designated the first phase, has no consulted promoter (Viability Assessment [29] paragraph 8.71), a negative residual value and no infrastructure schedule.
On the plan's own trajectory the Council will have about one year's supply on adoption against its own requirement. The first five years deliver 1,457 homes against 7,220. None of those 1,457 are from SS18, and the 600 the trajectory counts from SS18 in the five years from adoption are the homes the promoter has said will not come. Basildon Borough Council was placed under Government direction in July 2026, when it could show only 1.96 years of deliverable housing supply against the five years national policy requires [95]. SS18 contributes nothing to closing that gap. What it does is help justify the 28,880 requirement against which that gap is measured.
5.2 Ground E2: the site loses money before it pays for anything
The numbers. The Council's Viability Assessment [29] (AspinallVerdi, 30 June 2026, Table 8.2, PDF pages 168 to 170) tests fifteen strategic sites. For site 60940, Lower Langdon: net residual land value minus £9,802,648. Existing use value £5,344,773. Multiplier minus 1.83. For site 60893, Corringham Park Farm: minus £913,632. Multiplier minus 1.26.
A residual land value is what is left for the landowner after build costs, policy costs and developer profit. A negative figure means the development does not cover its own costs before a penny is paid for land. Paragraph 8.65: "The site is shown to be unviable with the inclusion of 50% affordable housing (in line with the Golden Rules) alongside the £18,700 per unit in S106 contributions and site-specific infrastructure."
The affordable housing it would have to provide. The NPPF's Golden Rules (December 2024, paragraphs 156 to 157, the Framework this plan is examined against; repeated for applications in the August 2026 national policy GB8) require, on land released from the Green Belt, affordable housing 15 percentage points above the highest existing local requirement, capped at 50 per cent. Thurrock's existing requirement is 35 per cent (Policy DMP12). 35 plus 15 is 50. The Council's consultants therefore tested the site at 50 per cent, which is the rate any application on this land would face, and found it £9.8 million under water.
At the plan's own 35 per cent the site is still short: the consultants' sensitivity test finds the most it can carry is 34 per cent (8.66). The plan sets 35 per cent for SS18 (Table 5, page 317), and its supporting text (6.3.11) claims the strategic sites "could viably deliver" the percentages set. For Parcel a the Council's own evidence says otherwise.
Across the plan the consultants found "only 2no. strategic sites are capable of delivering the existing policy requirement for affordable housing alongside all other policy costs", and record that the Council "instructed [them] to consider the affordable housing contribution as the variable output in order to maintain viability" (9.18 to 9.19).
The borough's net affordable need is 825 homes a year. The price of keeping SS18 is 16 percentage points of affordable housing on 5,000 homes, about 800 affordable homes, and the plan does not say so. And all of that is on the Council's own figures for a site with none of its own constraints drawn on it. Once the land budget is built properly, on the Council's own numbers and with the constraints its own policies require (section 4.4), the affordable housing the site can carry falls from the Council's 34 per cent to 17 per cent at the Council's own capacity, to 5 per cent with the drainage land set aside, and to none once the SSSI buffer is applied. With the A13 bund and the SANG the land is £95 million to £102 million short at the plan's 35 per cent and no affordable housing is viable on any land price test (the rebuild below; Appendix I and Appendix J).
What the promoter would and would not fund. The promoters gave "relative assurance" of viability at 50 per cent "on the assumption that the emerging policy requirements and infrastructure contributions were not too onerous", and said "the extent of highways works in particular were seen as key to whether the site could be viable at 50% affordable" (8.69).
The consultants recommend the Council "re-engage with the promoters to ensure there is parity between the extent of infrastructure expected" (8.70). In plain terms: the promoter's viability position is conditional on the Council reducing the infrastructure it asks for, and the item the promoter singles out, the highways works, covers the £18.8 million northern access road (the new road through Lower Langdon from the A13 side up to its exit onto South Avenue, costed as one item), the £37.8 million east to west road, the £3 million Laindon Road link and the A13 junction works the plan relies on.
The A13 junctions carry a further problem: the Infrastructure Delivery Plan lists the handover of the A13 east of the A1089 and the A1014 to National Highways ("trunking") among the highway schemes for this part of the borough, and National Highways has now confirmed in answer to this representation's information request that it has no plan to adopt those roads before 2031, no funding to do so, and has assessed none of the junctions (section 5.3, "What National Highways says"; Appendix E6).
Whatever those junctions need, the Council and the developer must pay for it. The consultants' infrastructure assumption of £51,325 a home was "informed by" the Lower Langdon costs in the IDP [30] (8.64). It is the IDP's own total, £256,596,000 (Tables 13-3 and 13-4), divided by 5,000 homes. But the IDP schedule is costed for 4,000 homes and 9,600 people, and names Corringham Park Farm only as a bus destination and the end of a road. Nor does that total include the drainage land and works the national standard requires, their maintenance every year for the life of the development, the A13 noise barrier, the SANG or its 80 years of management (section 4.4; Appendices J, O and Q). Recalculated for this representation on the Council's own figures, the cost is £64,149 a home, 25 per cent more than the viability study assumed, before water (costed "Unknown"), sewerage (no item, though the Council's own study says new infrastructure is required), rail (no item), the bus routes and SANG (uncosted), land assembly, utility diversions, inflation and optimism bias. At £64,149 a home the residual land value falls further below minus £9.8 million.
These are this representation's calculations from the Council's own published figures. The Council has made none of them. (Appendix J)
Who pays. The IDP's own summary puts Lower Langdon's known infrastructure at £256,596,000: transport £172,299,000, education £59,397,000, community £12,074,000, green and blue infrastructure £9,688,000, healthcare £3,138,000. Emergency services and water "n/a" (Tables 13-3 and 13-4, pages 177 to 178). Every entry's funding source in the schedule [31] is "Developer Contributions". Every entry's "Potential Gap" is blank.
Police (£21.0 million) and fire (£11.8 million) are "Unfunded".
The Council is under Best Value Commissioner intervention until at least April 2028 and has no capital programme for this site. There is no delivery vehicle, no compulsory purchase costing and no land assembly evidence. The £256.6 million is a floor, not an estimate, and this representation has already shown its major omissions: the items it leaves out that can be priced from the public record add £20 million to £80 million (drainage and its maintenance, the noise bund, the SANG, the emergency services contributions the IDP itself seeks per dwelling), and the items that cannot be priced from anything the Council has published (sewerage, water, bus services, healthcare premises, land, inflation, optimism bias) are each positive (Appendix J). The plan's answer to "who pays" is a developer who, on the Council's own figures, loses £9.8 million before paying anything, and who has told the Council its position depends on paying less. On the Council's own total and the omissions that can be priced, the bill no one has taken ownership of is £277 million to £337 million, before the items that cannot yet be priced are added.
The five-year risk of an under-performing allocation. Allocation settles the principle of development. Once SS18 is in an adopted plan the Council can argue only the detail. On its own trajectory the Council has about one year's housing land supply on adoption against its own 1,444-a-year requirement, and that counts the 600 homes from SS18 that the promoter has told the Council's consultants will not come. On the promoter's account the supply is lower still. It also has a Housing Delivery Test result of about 27 per cent against a pass mark of 75. The December 2024 NPPF [74] removed the earlier exemption for authorities with a plan under five years old.
From the day of adoption the presumption in favour of sustainable development applies to any application, including one on SS18 that departs from the policy's masterplan, phasing, SANG and infrastructure requirements.
The developer applies with the Council's own viability study in hand, showing the site cannot carry the affordable housing or infrastructure the policy requires. Policy DMP12 permits a site-specific viability case. The contributions come down. A refusal is lost on appeal, with costs.
Permission to build does not equate to homes built: as the Cabinet Member said on 26 August, "we can't force developers to build", so a consented but unstarted site sits in the supply while delivery falls and the presumption strengthens.
The promoter has already said the site will not contribute in the first five years.
The plan therefore allocates a site that will not help the five-year supply, will be permitted on appeal on the developer's terms if the supply fails, and will then deliver less affordable housing and less infrastructure than the policy promises. Land kept in the Green Belt under an adopted plan is, by contrast, the strongest footing for a refusal: Green Belt policy disapplies the tilted balance except on grey belt, which this land is not (Gladman Developments Ltd v SSHCLG [2021] EWCA Civ 104).
The risk, put shortly, is this. Policy SS18 releases some of the borough's most valuable Green Belt for a site that, on the Council's own evidence, will produce nothing in the first five years. From the day of adoption that land is open to applications and appeals decided on the developer's terms, outside the control the plan was meant to give the Council.
A plan that creates that exposure for no five-year benefit is not effective. The land is protected only while it stays in the Green Belt under an adopted plan.
What this representation did with the Council's viability figures, in plain terms. The Council's viability consultants (AspinallVerdi) published their working: one development appraisal for each parcel, printed in the appendix to the Viability Assessment [29], Lower Langdon (site 60940) at 4,250 homes and 34 per cent affordable housing (PDF pages 1142 to 1148) and Corringham Park Farm (site 60893) at 1,000 homes and 39 per cent (PDF pages 1205 to 1211).
Between them they model 5,250 homes for a 5,000-home allocation, including 4,250 on a parcel the Council's own housing land study puts at 3,378 [15].
For this representation, both appraisals were rebuilt line by line in a spreadsheet model from the figures printed on those pages: the unit mix, floor areas, sale values, build costs, external works, policy costs, contingency, fees, Section 106, sales costs, profit, stamp duty, acquisition costs and land interest.
The rebuilt model reproduces every printed sales value, total cost and residual land value to the pound, which is the check that the model is the Council's and not ours. The one item the Council did not print, development finance, is held at the printed share of costs. Checked against the Council's own sensitivity tables, the rebuild is within £0.15 million for Lower Langdon between 20 and 35 per cent affordable housing and within £1.3 million for Corringham Park Farm. Having reproduced the Council's figures, two inputs, and only two, were then changed to what the Council's own documents say they should be.
Everything else, every price, cost and rate, is the Council's. The method, the inputs and every result are at Appendix J. [133]
The two corrections. The first is infrastructure.
At the policy's 5,000 homes the Council's two appraisals carry £235.3 million of infrastructure (4,000 homes at £51,325 each and 1,000 at a generic £30,000), which is £21.3 million less than the £256,596,000 the Council's own Infrastructure Delivery Plan gives for the settlement, a total that Policy SS18 says infrastructure for both parcels will follow (page 294) and that the viability study itself divides by 5,000 homes (8.64). The rebuild uses the Council's own £256.6 million.
Where fewer homes fit, the transport element (£172.3 million) is held fixed and the rest is scaled down with the homes, which favours the Council.
Nothing the Council has not itself priced is added, except, shown separately in the last two rows of the table, the A13 noise bund and fence and the SANG that Natural England's standard requires, neither of which the plan provides for. No drainage construction, water, sewerage, rail or optimism bias is added. Each would lower every figure.
The second is the number of homes: first the policy's 5,000, then the Council's own capacity of 3,841 (3,378 for site 60940 in its housing land study [15], PDF page 37, and its consultants' best-practice 463 for Corringham Park Farm [14], Table 5-5, PDF page 25), then the homes that remain as each constraint the Council's own policies require is drawn on the land, the drainage land, the Fell-me-down Shaw buffer, the SSSI buffer and the Lodge Hall Shaw buffer (section 4.4; proportional estimates, not layouts). Each parcel keeps its own sale values, and the same affordable housing percentage is applied to both.
A technical note on the land price test, which decides how much affordable housing a site is said to carry. The consultants' test is that a site can carry affordable housing up to the point where the land is still worth ten times its existing use value (Table 8.2). Their printed appraisals do not match that rule: at their own maxima of 34 per cent for Lower Langdon and 39 per cent for Corringham Park Farm the land is worth about 13 times existing use value, not ten, and both published maxima are reproduced exactly by a threshold of about 13 times (the "five times" column by about 6.8 times). On the ten times they state, their own appraisals would allow about 38 and 41 per cent. Their headline figure of minus £9,802,648 at 50 per cent is not reproduced by their own sensitivity table either, which gives about minus £4.5 million.
The Inspector is asked to require the Council to say which model and which land price the plan relies on. So that every figure below starts from the Council's own published 34 per cent, this representation uses the threshold that reproduces it. On the stated ten times every result would be 3 to 6 points higher and the conclusion the same (Figure 4).
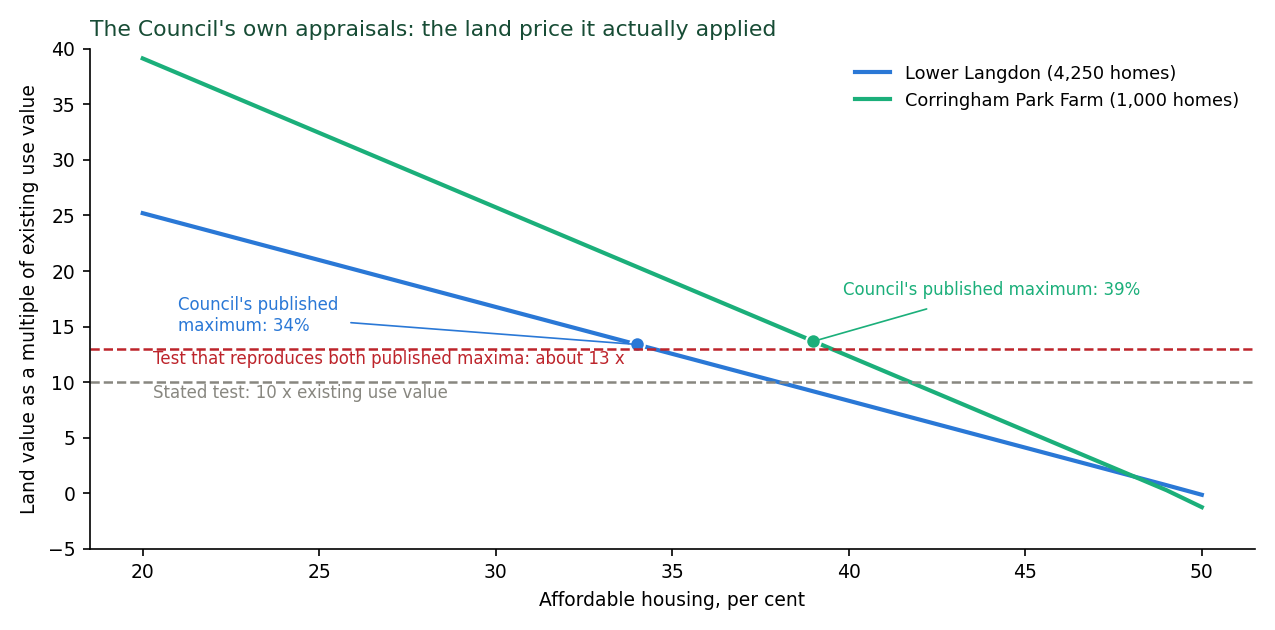
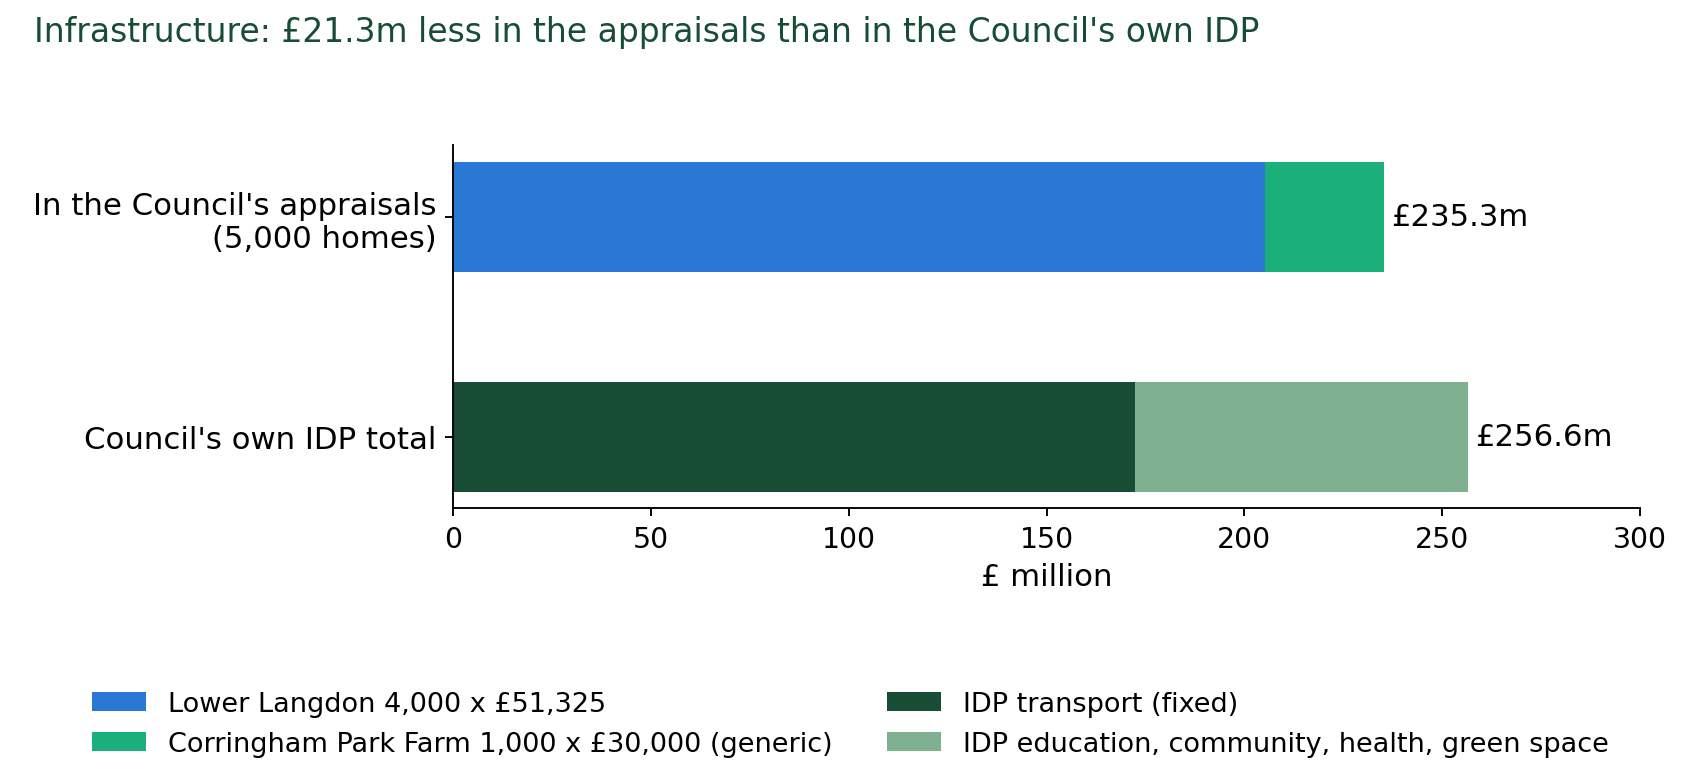
Table 5.2. SS18 as one scheme: the homes, the infrastructure cost and the most affordable housing the land can carry, on the Council's own appraisals rebuilt step by step.
SS18 as one scheme |
Homes |
Infrastructure |
Most affordable housing, Council's applied test |
at the stated ten times |
Land value at the plan's 35% |
|---|---|---|---|---|---|
Council's appraisals as printed |
4,250 + 1,000 |
£248.1m |
35% |
38% |
£80.9m |
Policy homes, Council's appraisal rates |
4,000 + 1,000 |
£235.3m |
34% |
38% |
£76.8m |
Policy homes, Council's own IDP total |
4,000 + 1,000 |
£256.6m |
30% |
33% |
£53.4m |
Council's own capacity |
3,378 + 463 |
£237.1m |
17% |
21% |
£7.2m |
Plus drainage land the Council's rule needs |
2,867 + 356 |
£226.6m |
5% |
11% |
minus £23.4m |
Plus Fell-me-down Shaw ancient woodland buffer |
2,729 + 356 |
£224.3m |
2% |
7% |
minus £31.6m |
Plus 50 m SSSI buffer |
2,661 + 250 |
£221.4m |
none |
4% |
minus £38.8m |
Plus Lodge Hall Shaw buffer |
2,611 + 250 |
£220.5m |
none |
2% |
minus £41.8m |
Plus A13 noise bund and fence (not in the plan; £2.7m to £6.5m) |
2,532 + 202 |
£221.1m to £224.9m |
none |
none |
minus £51.1m to minus £55.5m |
Plus SANG to Natural England's standard (not in the plan; with the bund, £10.6m to £16.9m) |
1,964 + 162 |
£218.8m to £225.0m |
none |
none |
minus £95.1m to minus £102.4m |
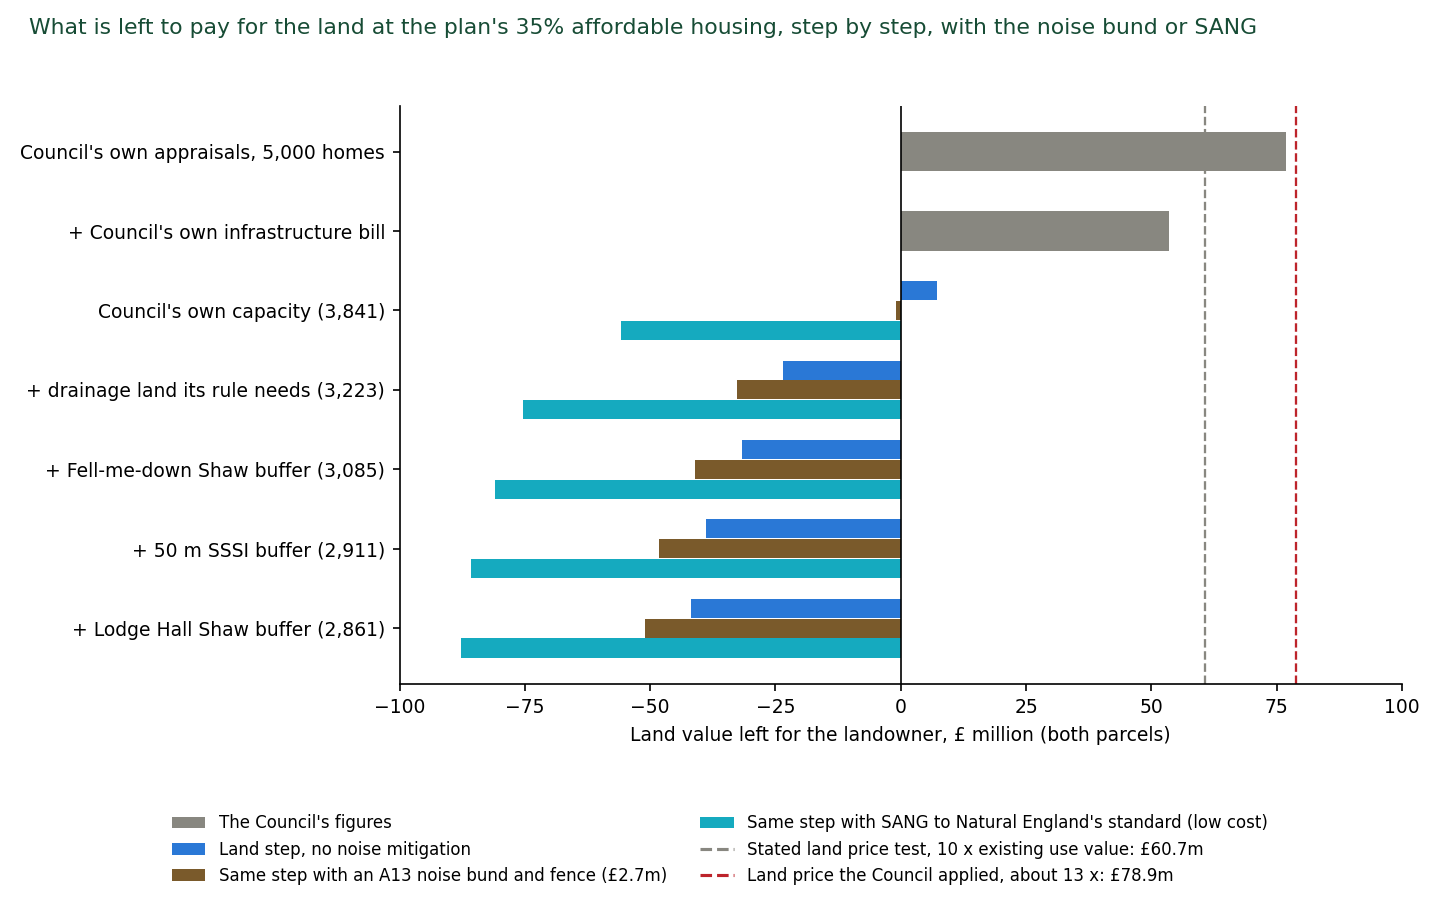
What it shows. The result can be read in one line of the table and one glance at Figure 6: the affordable housing SS18 can carry falls to nothing once the Council's own constraints are counted, and the land is then tens of millions of pounds short of what the Council's own test requires. Step by step:
-
On the Council's own appraisals and its own test, SS18 supports 34 per cent affordable housing, already below the plan's 35.
-
With the Council's own infrastructure total in place of the lower figure the appraisals used, 30 per cent.
-
On the Council's own capacity of 3,841 homes instead of the appraisals' 5,250, 17 per cent.
-
With the land the Council's own policies require set aside, which the Council's analysis omitted: 5 per cent with the drainage land, 2 per cent with the Fell-me-down Shaw buffer, and none once the SSSI buffer is applied. At that point the scheme cannot pay the Council's own land price even with no affordable housing at all.
-
Adding the A13 noise bund and fence, which the plan does not provide for, leaves 2,734 homes and the land £51 million to £56 million short at the plan's 35 per cent, with no affordable housing viable even on the stated ten-times test (Appendix Q). Added at each step rather than the last (Figure 6), the bund takes the Council's own capacity from 17 per cent to 14, the drainage step from 5 to 2, and leaves none from the Fell-me-down Shaw step onward.
-
Protecting the SSSI to Natural England's own standard costs more again.
Setting aside 8 hectares of SANG per 1,000 new residents, after counting the capacity study's open space towards it, takes about 27 hectares more land and £7.9 million to £10.4 million for its works and 80 years' management [140]. With the bund it leaves 2,126 homes and the land £95 million to £102 million short at 35 per cent, with no affordable housing viable even at five times existing use value. Applied to the Council's own capacity alone, with no other constraint, the SANG leaves 2,919 homes and no affordable housing on either test (Figure 6).
The 50 per cent the Golden Rules expect on released Green Belt is out of reach in every case, including the Council's own. Read against the stated ten-times test the figures are 3 to 6 points higher and the conclusion is the same.
The Green Belt is released for this site on the strength of the homes, including affordable homes, it will deliver. On the Council's own evidence, corrected only by the Council's own figures, it cannot deliver them. This is put as evidence that the allocation is not effective and that exceptional circumstances are not demonstrated, not as a free-standing viability ground (section 8). [133; full method and results at Appendix J]
Test engaged. Effective.
The Council's reply will be that the site is viable at 34 per cent and the policy will be modified. That concedes that the plan as published sets a requirement its own evidence says the site cannot meet, that the price of the site is about 800 affordable homes, and that the Golden Rules figure any application would face is 50. It does not answer the promoter's own delivery statement, the £9.8 million, or the question of who pays.
5.3 Ground E3: the infrastructure is calculated for 4,000 homes, funded by nobody, and confirmed by no provider
4,000 not 5,000. The Lower Langdon schedule in the IDP [30] resolves every line to 4,000 dwellings and 9,600 people. Policy SS18 allocates 5,000 dwellings and about 12,000 people.
Corringham Park Farm appears in the IDP schedule only as a destination of the two bus routes and the end of the east to west road. No school, health or open space line is calculated for its 1,000 homes, and the viability study appraised it at a generic £30,000 a home (8.72). (IDP Schedule Part 2 [31])
Funded by nobody. Every Lower Langdon item is funded from "Developer Contributions". The "Potential Gap" column is blank throughout. Essex Police (£16.3 million, £4.2 million, £0.6 million) and Essex County Fire and Rescue (£11.8 million) are "Unfunded". The two bus routes are uncosted. The SANG has no cost. The borough-wide water cost is "Unknown" (IDP Table 13-3, page 176). There is no water, wastewater, energy or digital entry for Lower Langdon. The site whose contributions fund all of this is, on the Council's own evidence, unviable before it pays for any of it.
Nor are the required A13 modifications funded by the national road operator: the plan's Infrastructure Delivery Plan assumes the A13/A1014 corridor, with its junctions, will be trunked to National Highways, and National Highways told this representation on 8 October 2026 that it has no plan and no funding to adopt those roads in 2026 to 2031 and has assessed none of the junctions for the plan (What National Highways says, below).
Health. Policy SS18 requires "approximately 600 sqm" of healthcare floorspace. The IDP requires 686 square metres and records in the same row that "New GP surgeries usually have an NIA of 700-1,000m2". At an indicative list size of 1,750 patients per GP, 12,000 people need in the order of seven GPs. The plan provides floorspace below one standard surgery.
The 686 square metres figure is itself derived pro rata from West Horndon's 1,714 square metres for 10,000 homes, which resolves to about 4,000 homes, not 5,000.
The IDP's open space lines resolve the same way: natural and semi-natural open space 17.28 ha at 1.80 ha per 1,000 people, parks 7.68 ha at 0.80, amenity space 5.76 ha at 0.60: every line implies 9,600 people and 4,000 dwellings. Policy SS18 allocates 5,000 dwellings and about 12,000 people.
The IDP records the Integrated Care Board's position: existing GP floorspace is already short in every Primary Care Network (Stanford-le-Hope minus 937 square metres, Grays minus 604, Tilbury and Chadwell minus 834, Aveley/South Ockendon/Purfleet minus 715), only five of twenty-six practices have spare capacity, and the ICB "is not funded to act as a property developer, even providing land only or buildings to be leased on commercial terms presents an unaffordable financial burden" (IDP pages 115 to 116, line 5509).
Basildon University Hospital, the acute hospital for the whole borough, has had no assessment: the words "A&E", "accident and emergency" and "emergency department" appear nowhere in the plan, the IIA [8], the HRA [11], the Regulation 18 Consultation Statement [7], the Cabinet report [4] or the site transport assessment [14]. Mid and South Essex NHS Foundation Trust, which runs the hospital, is not on the list of bodies consulted. The Consultation Statement records that "healthcare capacity was one of the most significant concerns across the consultation, particularly in relation to GP surgeries, Basildon Hospital and future healthcare provision" (section 7.8).
The IDP misstates the hospital's condition. It says: "The most recent Care Quality Commission inspection of the Hospital took place in 2019. The commission rated the trust as good overall" (IDP lines 5156 to 5157). On 15 October 2025, nine months before the IDP was published, the Care Quality Commission dropped Basildon University Hospital from "requires improvement" to "inadequate", rated its urgent and emergency services inadequate overall and inadequate for safe and well-led, and served a Section 31 notice imposing conditions on the provider's registration "because people would be at risk of harm if it did not take this action". Inspectors found "serious overcrowding" in the emergency department [113]. Thurrock's own Cabinet Member for Health said the report "lays bare the failures of the hospital trust". England recorded 27.4 million A&E attendances in 2024-25, about 0.47 per person [119]. SS18's 12,000 people therefore imply in the order of 3,700 to 5,600 additional attendances a year, most at Basildon. The plan contains no assessment of Basildon Hospital's recent downgrading. (Appendix P)
Community and emergency services. The IDP's library entry for the site is "Unfunded". Essex Police's three entries are £16,266,457, £4,153,000 and £552,247, all "Unfunded". Essex County Fire and Rescue's is £11,804,450, "Unfunded". No funder other than developer contributions is named for any of them.
Water supply: the plan exceeds what the water company planned for. Essex & Suffolk Water's final Water Resources Management Plan (15 October 2024) [116] states: "We have a baseline supply deficit in both our Suffolk and Essex supply areas from 2025 and so we have not been considered as a donor water company. The same applies to our neighbours Anglian Water and Thames Water" (PDF page 28). The Essex zone's baseline dry-year deficit is 35.51 million litres a day in 2029/30 and 43.87 in 2034/35 (Table 52). The final plan closes it with a surplus of only 16.99 million litres a day across the whole Essex zone (Table 70), and without the new Linford works "the surplus in 2027/28 would only be 0.13 Ml/d" (PDF page 174).
The Water Cycle Study (6.2.2) records that the water company's plan allowed for 19,460 homes in Thurrock over a 20-year plan period, and itself calculated a shortfall of 14,020 homes against the highest growth option. The detailed study it said should investigate that shortfall was never produced.
The plan's in-period supply of 25,406 is 5,946 homes above the water company's allowance. SS18's 3,400 in-period homes are 57 per cent of that excess. On the water company's own ratio (15 million litres a day for every 30,000 homes, IDP page 76) the excess draws about 3 million litres a day, some 17 per cent of the whole Essex zone's planned surplus.
The water company's plan publishes no Thurrock figure. Its local authority breakdown is available "on request" (PDF page 89).
The Council knew. In its 2023 response to the water company's draft plan, Thurrock Council said the household projections were "very conservative estimates" that "do not properly reflect the likely levels of growth that will come forward", and asked for them to be raised. The water company replied that it is "directed to use the Local Authority Housing Plan (LA) projections rather than Housing Need" (Statement of Response [117], ref 69, PDF page 69). The Council also told the water company that "the assumptions being made about behavioural change to water use are overly optimistic" and, given "several quite considerable leaks ... because of aging infrastructure", that "the reduction in demand from this area is somewhat optimistic" (refs 71 and 72).
The IDP's conclusion that water supply will be sufficient depends on "the successful implementation of demand-side measures ... There will need to be a significant reduction in per capita consumption to achieve this" (page 76). The Council relies in 2026 on assumptions it called over-optimistic in 2023, and on a supply plan it knew did not provide for its growth. (Appendix K)
Sewerage. No sewer, no costed connection, and a receiving works already spilling for lack of capacity with no improvement action recorded (sections 3.1 and 4.6). Anglian Water's Drainage and Wastewater Management Plan, as reported in the IDP (page 75), forecasts the Tilbury catchment population rising "from 153,000 in 2021 to over 180,000 in 2050". SS18 alone is about 44 per cent of that growth, and the same plan rates the catchment "very significant" for "pollution incidents and sewer collapses" (WCS 5.4.1). Anglian Water, the sewerage undertaker for this land, has given data to the Council's consultants for a detailed Water Cycle Study that has not been published, but it has not confirmed capacity for SS18, has made no assessment of the site or its connection, and has signed no statement of common ground with the Council (section 5.5). The HRA's own water-quality conclusion relies instead on Southern Water, which serves no part of the borough (section 3.1).
Rail. The site transport assessment forecasts 361 additional peak-hour rail trips, about 108 extra passengers per service in the morning peak towards London, and identifies 66 station parking spaces at Stanford-le-Hope (141 including the NCP car park), in a town where most streets south of the A1014 are permit-controlled.
The rail figures in full: 361 rail trips in the morning peak hour and 442 in the evening, about 90 per cent towards central London. Parking at the three stations the assessment considers: Stanford-le-Hope, 0.8 km from the site, 66 spaces. Basildon, 1.7 km from Corringham Park Farm, no dedicated station car park. Laindon, 2.75 km, 243 spaces. From personal experience, these car parks are at capacity.
There is no proposal in the plan, the assessment or the IDP to increase station parking, provide a car park or fund any station capacity works, and the Lower Langdon infrastructure schedule contains no rail item. The IDP's borough schedule lists "Construction of Stanford-le-Hope station building ... bus interchange" as "Unfunded" and "Excluded from costing". The overspill parks on the streets of Stanford-le-Hope and Corringham, a harm to existing residents that is unassessed.
The assessment describes the station as offering five peak services to London (section 2.3.2.1) and calculates its impact on three (section 6.3.3). Its 108-passengers-per-service figure depends on which is right, and both cannot be. The 2023 Initial Proposals [48] floated a new Corringham station and interchange. Essex County Council questioned its deliverability. It is absent from the delivery evidence. The site assessment concedes that walking to the station "necessitate[s] crossing the A13, which acts as a barrier to convenient and attractive active travel" (section 2.3.3) while assuming a 29 per cent walking mode share.
The plan-wide Transport Assessment [32] (12 August 2026) states that rail capacity "will need to be monitored and explored with National Rail and C2C as appropriate", that "any new services that will be required to service the major site allocations at West Horndon, South Ockendon and Lower Langdon have not been tested through this transport assessment", and that the walking, cycling and bus programmes the growth depends on "do not have committed funding" (paragraphs 6.2.1, 6.2.2, 6.5.1, 6.5.4). The Council has had since December 2023, when its own Initial Proposals listed engagement with Network Rail and c2c as work to be done before allocation, to obtain passenger loading data for the c2c line on which every Thurrock station depends, and no published record shows that it did. No published record shows any engagement with c2c or Network Rail on SS18. The IDP lists Stanford-le-Hope station upgrades as "Unfunded" and "Excluded from costing" (Schedule Part 1, line 3471).
Roads. The site transport assessment (Table 6-7) models the A13/B1007/A1014 northbound diverge (node 76225) rising from 84.95 per cent to 102.55 per cent of capacity in the morning peak with the plan, and the northbound merge from 53.85 to 93.55 per cent.
The four junctions and the Council's response to each: node 76225, A13/B1007/A1014 northbound diverge, 84.95 to 102.55 per cent, "N/A - junction identified for further monitoring". Node 76231, northbound merge, 53.85 to 93.55 per cent, "further monitoring". Node 76237, A13/A176 eastbound off-slip, mainline "approaching capacity", merging and weaving issues, "monitoring is recommended". Node 76239, A13 Stanford-le-Hope bypass westbound on-slip at Five Bells, "approaching capacity", "monitoring is recommended". The forecast that produces them: 1,477 car driver trips out in the morning peak hour and 1,558 in the evening. 2,458 and 2,594 external trips by all modes.
The receiving roads, in the assessment's own words: the B1007 North Hill, "a single-lane carriageway with landscape verges on both sides, HGV [heavy goods vehicle] restrictions and a speed limit of 60mph ... no footways are provided on the southern side of the route where it meets the site's boundaries". One Tree Hill, "a single-lane carriageway of national speed limit, with several narrow sections where vehicle passing is constrained". Vange Park Road, "along the site frontage ... a single-track road". Bells Hill Road, "a narrow residential road with a 30mph speed limit and no footways present". To the north and east, "rural and wildlife areas with limited highway coverage and a small number of local roads".
Of the nine access works costed for Lower Langdon, one is on the A13 (£7,650,000 for the dormant dumbbell junction). The rest discharge onto the B1007 (£4,500,000 and £1,500,000), One Tree Hill (£4,050,000), the Nether Mayne roundabout (£4,500,000), Vange Park Road (£5,248,752), South Avenue (£18,758,628) and, potentially, Laindon Road (£3,000,000), with a £37,799,963 east to west road between them.
The assessment anticipates the site becoming a cut-through ("a bus gate ... to prevent vehicles e.g. from Corringham using the Lower Langdon site as shortcut to access A13", section 5.9) and proposes nothing for the reverse movement north when the A13 queues, which on its own figures it will. Four junctions are rated "high" impact. The mitigation column for each reads "N/A - junction identified for further monitoring".
The assessment never applies the "severe" residual cumulative impact test in NPPF paragraph 116. National Highways asked at Regulation 18 for a sensitivity test without the Lower Thames Crossing. None was done. And the four junctions are not National Highways' problem to solve: on 8 October 2026 National Highways confirmed to this representation that the A13 east of the A1089 and the A1014 are not part of the national network, that it has no plan or funding to adopt them in 2026 to 2031, and that it has "not carried out specific assessments of these junctions" for the plan (What National Highways says, below). Every mitigation at these junctions therefore falls to the Council and to developer contributions from a site the Council's own viability evidence finds unviable.
Policy SS18 promises a "high-frequency bus route". The assessment specifies two services an hour on one route and one every 45 minutes on the other, peaks only, 07:00 to 19:00, no Sunday service, both "illustrative" and both uncosted.
What National Highways says (8 October 2026). Asked the three questions and the information request set out at Appendix C, National Highways replied on 8 October 2026 (Appendix E, item E6; [143]). It "agreed the methodology" for the Council's transport model and "reviewed the Thurrock Strategic Model Forecasting report", and is "currently in the process of reviewing the published evidence", including the Transport Assessment and the Lower Langdon site assessment, as a Regulation 19 consultee.
But "there has been no site-specific consultation between National Highways and Thurrock Council" on the SS18 allocation at 5,000 homes together with the 3,300 further homes at Corringham, Stanford-le-Hope and Horndon-on-the-Hill, and its Regulation 19 response "will not make individual reference to the sites" unless "they are of relevance to the SRN".
The A13 east of the A1089 and the A1014, the roads onto which the four junctions above discharge, are "not part of the SRN and there are no plans to adopt these sections of road in the Road Investment Strategy 3 (RIS3) period, 2026 to 2031", "the Department for Transport has not identified it as a priority and no funding allocation has been made for trunking in RIS3". An internal National Highways email of 16 January 2026, released with the reply, records that the Lower Thames Crossing has made "no commitment" to trunk the A13/A1014 and that "A13/A1014 trunking will not happen in RIS3 as there is no funding to support it". And "in connection with the Thurrock Local Plan, we have not carried out specific assessments of these junctions".
Three consequences follow:
First, the Infrastructure Delivery Plan lists "Stanford-le-Hope A13/A1014 trunking" (trunking means the transfer of a council road to National Highways as part of the national Strategic Road Network, so that National Highways becomes responsible for maintaining and improving it) among the highway schemes for this part of the borough (IDP [30], pages 33 and 57), and National Highways' own Regulation 18 response had anticipated that the road "could be adopted by National Highways within the Local Plan timeframe" (19 February 2024, paragraph 6, released with the reply).
Second, the four junctions that the Council's own assessment finds at or over capacity with the plan remain the Council's, with no national funding and no national assessment, and the Council's answer to each is "further monitoring".
Third, the plan-making engagement that Circular 01/2022 contemplates, in which the capacity enhancements necessary for strategic growth are identified with the strategic highway authority (paragraph 29), has not taken place for this site: the authority agreed a model and was never asked about the allocation the model was run for.
The note of the one meeting the Transport Assessment records, on 24 November, was requested and was not among the documents supplied.
5.4 Ground E4: the northern access cannot be built as costed
The IDP [30] costs a "New Tertiary Road" at £18,758,628: "Road through Lower Langdon connecting to the northern site access onto South Avenue. Typical carriageway width 4.1m accommodating buses and other heavy vehicles (refuse, access to B1 and B2 employment areas) with c. 2m footway on both sides" (Schedule Part 2, line 402). South Avenue is an unmade, unadopted Plotlands lane about 445 metres long, without kerbs, footways or lighting, which joins Old Hill Avenue, another unmade lane. Both lanes are private and unadopted, in many ownerships, and lined by occupied homes and equestrian holdings (I live on Old Hill Avenue). Widening South Avenue to a 4.1-metre bus and lorry road with 2-metre footways on both sides means acquiring frontage land along its length, by agreement or by compulsory purchase.
No Council document identifies the land to be taken, its owners, the cost of acquisition and compensation, or the mechanism, and the IDP figure is construction only. Anyone who walks the lane sees the difficulty at once (Photographs 1 and 2, below). About seven occupied homes front the lane. Buying or compensating them, at the values homes on these lanes command, would on its own run to tens of millions of pounds that no Council document provides for. The geometry is worse than the cost. Measured against Natural England's unit polygons, the notified boundary of SSSI unit 22 (Old Hill and Great Sutton Wood) runs along the northern edge of South Avenue for its eastern 200 metres, between 2 and 5 metres from the lane's centreline.
The lane's northern verge is the SSSI. A 4.1-metre carriageway with 2-metre footways on both sides is a corridor at least 8.1 metres wide, 4 metres either side of the present centreline. Along the eastern 200 metres the SSSI boundary lies 2 to 5 metres from that centreline, so the road as specified cannot be built without entering the SSSI, which is an operation requiring Natural England's consent under section 28E of the Wildlife and Countryside Act 1981 and which the plan's own Policy DMP24 does not permit. And the lane and its verges are the land that joins the separate woodland blocks of the SSSI, such as Old Hill Woods. A bus and lorry road along it severs the connection between them, and the badgers, bats and owls that forage from one block to the other across the lane (Appendix D) would have to cross a lit road carrying buses and lorries to do so. Nobody living on either road has been consulted.
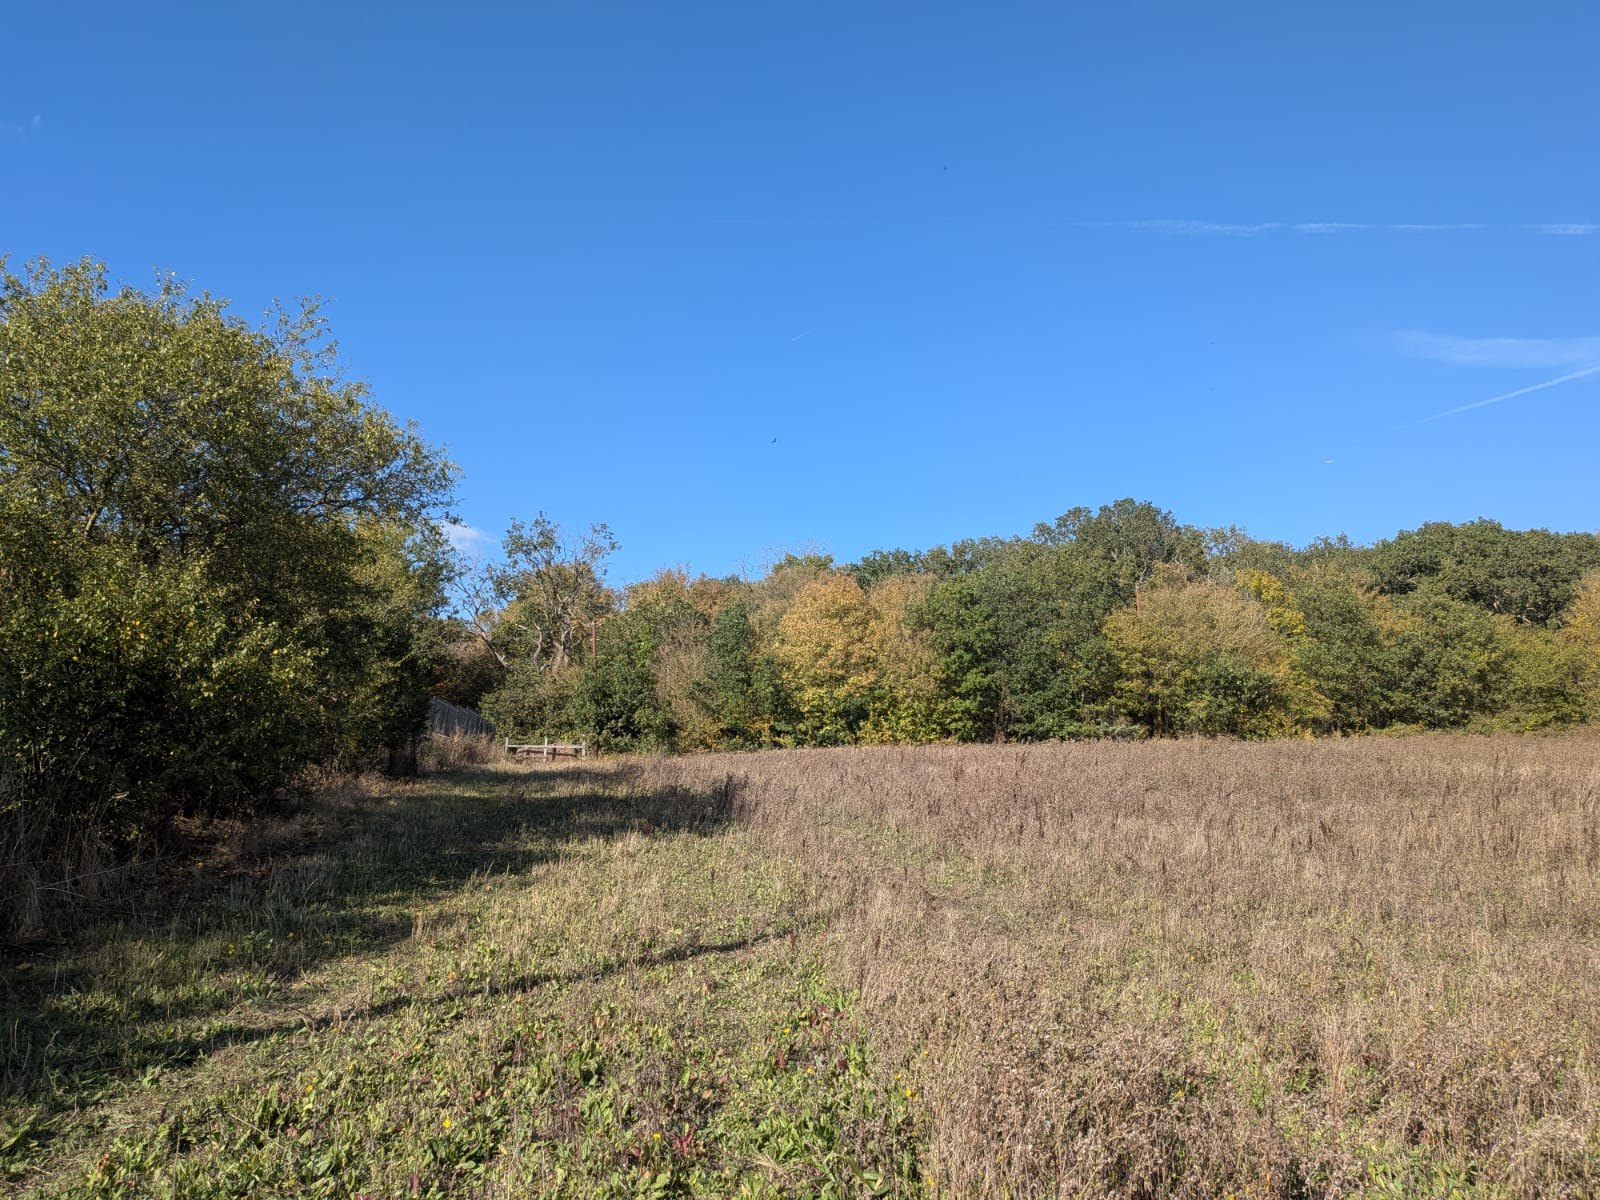
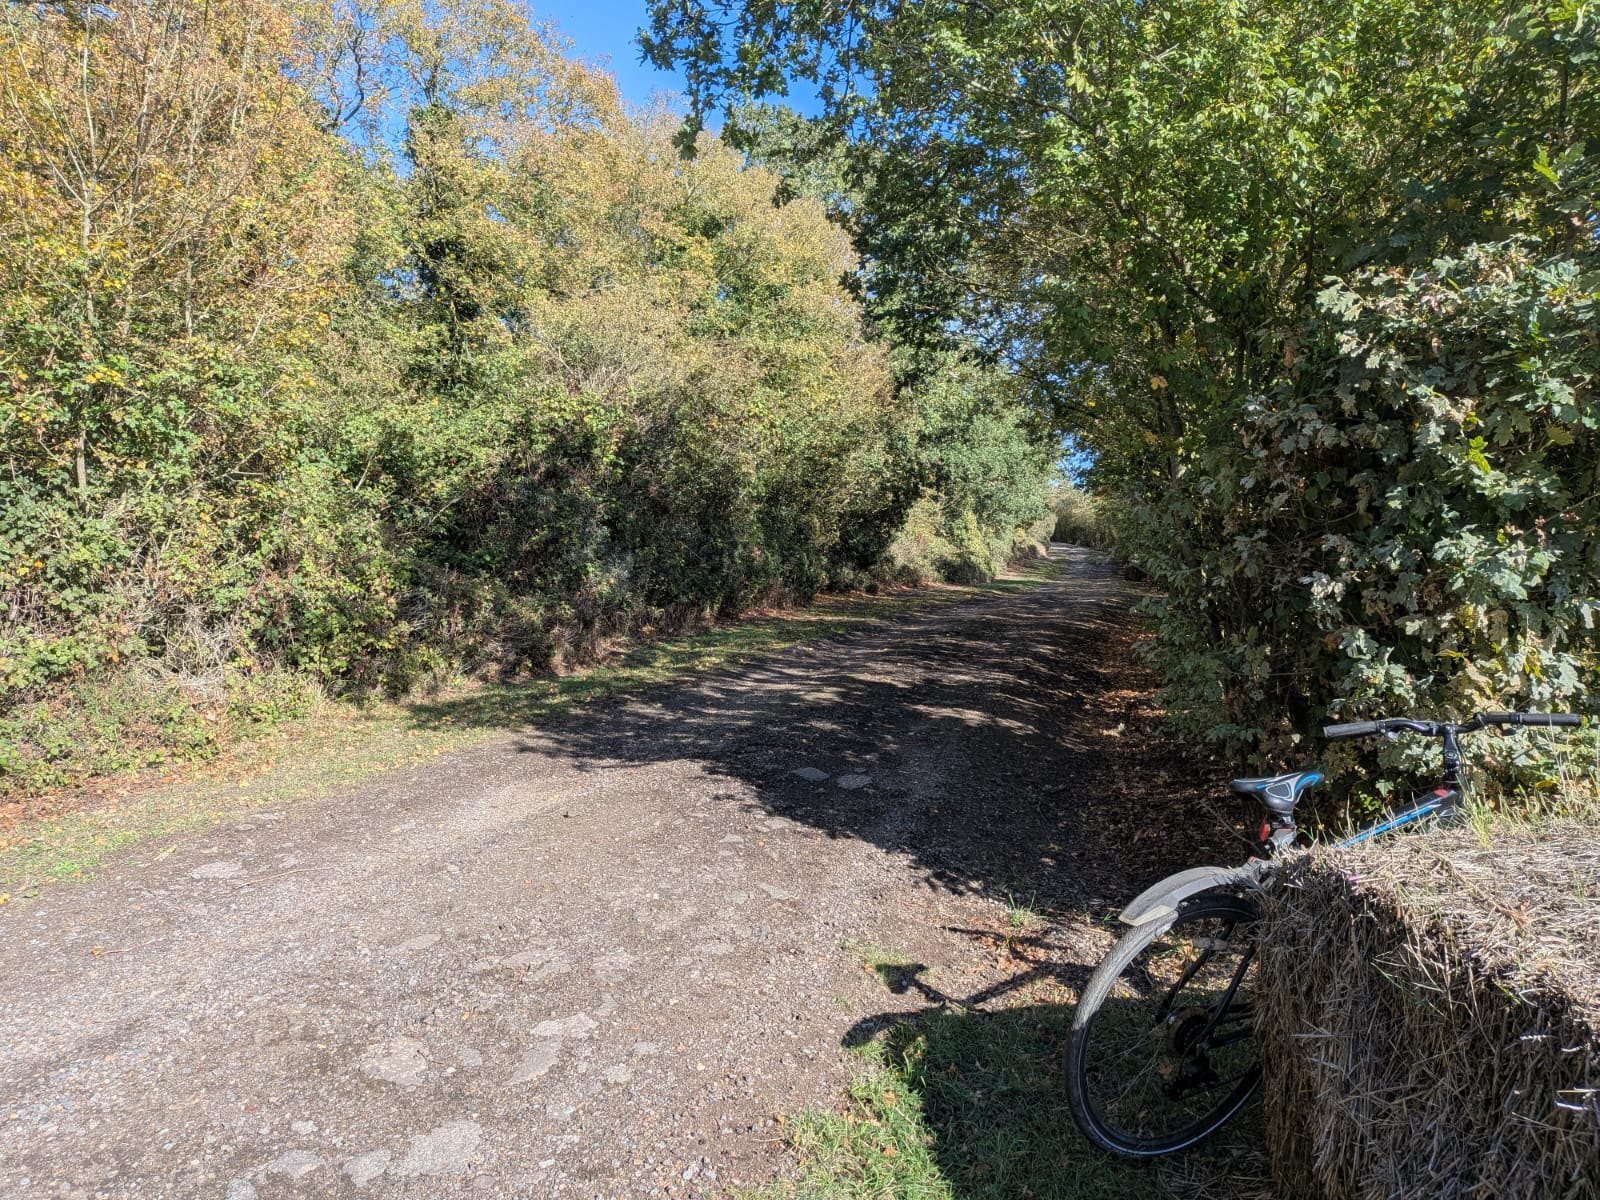
The two lanes, from OpenStreetMap and Natural England's data: South Avenue, 445 metres, unclassified, connecting only to Old Hill Avenue, Meadow Drive, bridleways and footpaths and one private service road, 2 metres from the SSSI boundary at its eastern end and 6 metres at its midpoint. Old Hill Avenue, 444 metres, residential, unpaved, a dead end, 81 metres from the SSSI at its eastern end.
Neither connects to any classified road. The £18,758,628 road appears in one spreadsheet cell of the IDP. The words "South Avenue" do not appear anywhere in the site transport assessment [14], and the northern access is not named in Policy SS18.
The Council's own transport assessment applied a 15-metre setback to "Woodlands and Protected Habitats", the bare minimum in Natural England and Forestry Commission standing advice for ancient woodland, and applied it when calculating developable area, not when designing any road. Within the immediate area the mapping records 34 separate woodland and grassland parcels, including Fell-me-down Shaw, the Local Wildlife Site Policy SS18 itself requires to be "retained and enhanced".
The IDP also costs, at £3,000,000, a "Potential new access between Laindon Road and the northern access junction to the site" (line 457), drawn on the site assessment's Figures 5-10 and 5-11 (PDF pages 31 and 32) as a dashed line running north-west from the northern parcel with the annotation "to be explored". Every route from that parcel to Laindon Road crosses the woodland belt north of the site: Great Sutton Wood and Old Hill, ancient and long-established woodland inside Langdon Ridge SSSI.
As the next paragraph shows, that is a road national policy says must be refused and the SSSI's statutory protection does not allow. The £3 million is the cost of a road no decision-maker could approve, and without it the only northern exit from the allocation is South Avenue.
The Ancient Woodland Inventory [90] records ten parcels in that belt, every one inside the SSSI: Northlands Wood 18.4 ha, an unnamed parcel at Langdon Hills 9.5 ha, Hall Wood 8.0 ha, an unnamed parcel to the east 7.2 ha, Coombe Wood 6.7 ha, Great Sutton Wood 3.0 ha, Long Wood 1.6 ha and 0.5 ha, Hoppit Shaw 1.1 ha, Marks Hill Wood 0.5 ha: about 56.5 hectares of irreplaceable habitat, ten of ten inside the SSSI.
Great Sutton Wood sits at the allocation's northern extent. Natural England's SSSI supporting information [23] treats "Old Hill/Great Sutton Wood (13 ha)" as one block, of which 3.0 ha is ancient and the remainder long-established semi-natural woodland, itself a notified feature. The residents at the top of Old Hill Avenue, whose lane the £18.76 million road would join and through whose immediate area the £3 million line is drawn, have been told nothing by the Council about either, and the site assessment's own Figure 5-10 (Access and movement strategy, printed page 27, PDF page 31) draws the connection as a traffic-free route leaving the northern edge of parcel LL-01D and curving north-west through the wooded belt, which that map shades as ordinary green space rather than SSSI, to a box reading "Potential to connect to Laindon Road to be explored". The Council's own Site Selection Methodology [37] lists ancient woodland and SSSIs among the absolute constraints that "cannot be overcome".
NPPF paragraph 193(c) provides that development resulting in the loss or deterioration of irreplaceable habitats "should be refused, unless there are wholly exceptional reasons and a suitable compensation strategy exists". The August 2026 national decision-making policy N6(2), in force for every application since 17 August 2026, says the same. There is no alignment, cross-section, junction design, land take, tree survey or cost breakdown. There is £3,000,000 in a spreadsheet for a road national policy says must be refused.
The same policy now applies inside the allocation. Fell-me-down Shaw, which the capacity study treated as an ordinary wood with a 15-metre setback, was confirmed by Natural England as ancient woodland on 25 September 2026, and the Council's own layout surrounds it with housing. Natural England and Forestry Commission standing advice is that housing beside ancient woodland damages it, by trampling, dumping, pets, lighting, nutrient run-off and the loss of the surrounding land the wood's species depend on, and that 15 metres is a minimum, not a safe distance. An ancient wood enclosed by a new town declines, and the policy's word for it, "enhance", does not change that.
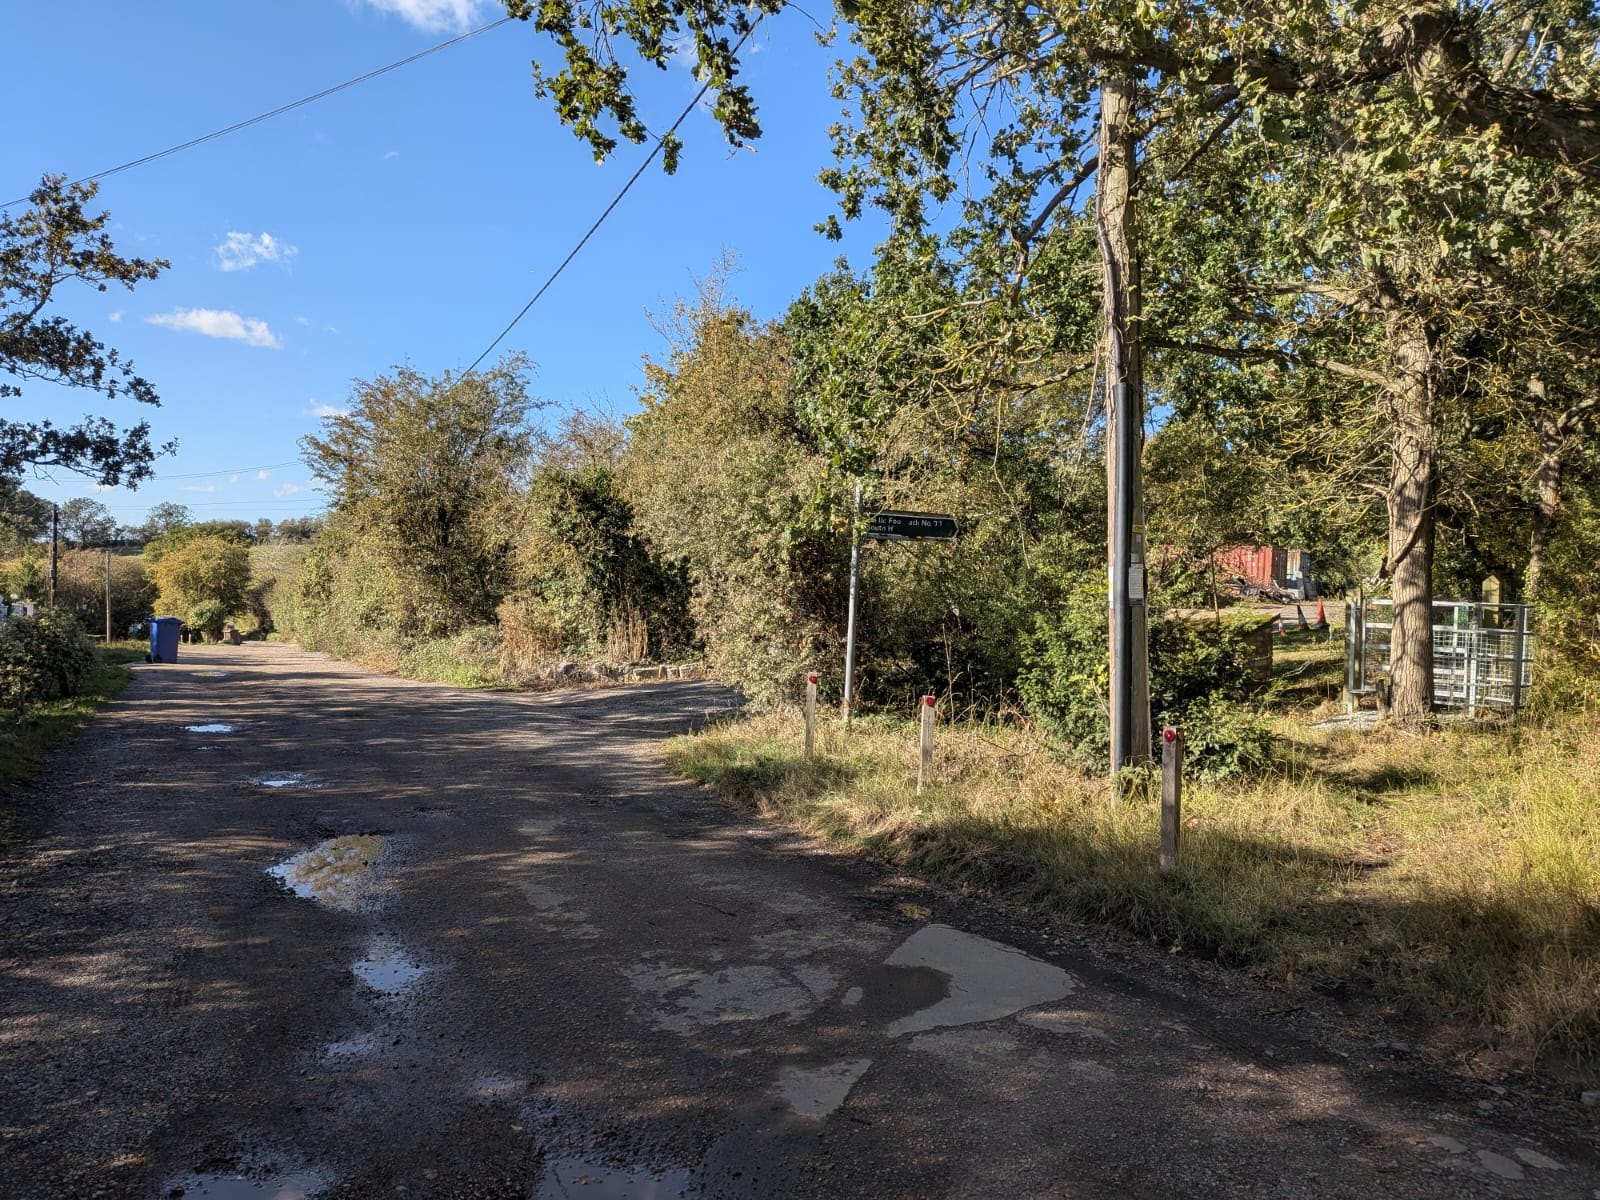
The only other northern route is over One Tree Hill, a single-lane road at the national speed limit through the Country Park, and down Dry Street, which runs for about 245 metres inside SSSI units 11 and 21. The site assessment forecasts 1,477 car driver trips in the morning peak and 1,558 in the evening peak, records that "a bus gate ... has been proposed at the eastern access of the site to prevent vehicles e.g. from Corringham using the Lower Langdon site as shortcut to access A13" (section 5.9), and proposes nothing to prevent the same traffic dispersing north onto One Tree Hill, the B1007, Dry Street and South Hill when the A13 queues, which on its own modelling it will. Of the nine access works costed for Lower Langdon, one is on the A13.
Test engaged. Effective. An allocation whose costed access depends on a Plotlands lane at a SSSI boundary and on a road through irreplaceable habitat is not deliverable as the plan describes it.
5.5 Ground E5: no effective joint working is evidenced
The statutory duty to cooperate ceased to apply on 25 March 2026 and this ground is not put as a legal one. What remains is the NPPF's requirement for "effective and on-going joint working" on strategic matters, evidenced through statements of common ground (paragraphs 24 to 27), and the Council's own Regulation 19 guidance, which makes "effective partnership working, including with neighbouring authorities" part of the effective test.
No statement of common ground with any body has been published. The Cabinet report [4] (paragraph 4.32) says they "will be pursued". The Statement of Community Involvement [53] (page 10) says the Council "will produce and maintain" them. Table 5.5 gathers, body by body, what each statutory body or provider asked for or is required to do and what the record shows. The bullets that follow give the detail.
Table 5.5. The bodies the allocation depends on, what each asked for or must do, and what the record shows. Sources are given in the section cited in the last column.
Body |
Role for SS18 |
What it asked for, or what the law or plan requires |
What the record shows |
Where |
|---|---|---|---|---|
Natural England |
Statutory consultee for Langdon Ridge SSSI and for the Habitats Regulations Assessment; section 28G and 28I duties |
Regulation 18 requests IP0173 and IP0179 (ecological evidence and SSSI protection); consultation under regulation 105(2) |
Promises not kept; "no records of any engagement" since 1 January 2023; no statement of common ground; no section 28I notice; the HRA does not assess SS18 |
4.6; Appendix E, E5 |
National Highways |
Strategic highway authority; the Infrastructure Delivery Plan assumes the A13/A1014 is trunked to it |
Regulation 18: sensitivity test without the Lower Thames Crossing; plan-making engagement under Circular 01/2022 |
Agreed the traffic model; never consulted on the SS18 allocation; no sensitivity test; no junction assessments; no plan or funding to adopt the A13 east of the A1089 in 2026 to 2031 |
5.3; Appendix E, E6 |
Historic England |
Statutory consultee for the historic environment |
Regulation 18: site Heritage Impact Assessments "ahead of the Regulation 19 plan" |
The assessment found harm that "should be avoided"; Historic England was never consulted on SS18 and has not seen it |
4.6; Appendix E, E4 |
Environment Agency |
Operating authority for the Main River through the site; flood risk consultee |
Approval of the Level 2 Strategic Flood Risk Assessment |
Holds no record of any consultation on the allocation (9 October 2026); its Regulation 18 advice that the new SFRA should provide the evidence for this site was not followed: the SFRA is an unapproved draft with no site model |
4.6; 5.5 |
Basildon Borough Council |
Neighbouring authority; most of Langdon Ridge SSSI lies in Basildon |
Objected at Regulation 18 (IP0024) and asked to be engaged |
Objection unresolved; no statement of common ground; no cumulative assessment with Basildon's own plan of about 28,000 homes |
5.5; 7.5 |
Essex County Council |
Highway authority for the roads north of the boundary that carry the settlement's traffic |
Asked to be "fully engaged in the further evolution of proposals" (IP0104) |
No published assessment of its roads; no statement of common ground |
5.3; 5.5 |
NHS (Mid and South Essex NHS Foundation Trust; Integrated Care Board) |
Acute hospital and primary care for 9,600 to 12,000 people |
Confirmation of capacity and funding |
Trust not consulted; the Board "is not funded to act as a property developer"; hospital rated inadequate in October 2025 and described by the IDP as "good" |
5.3 |
c2c and Network Rail |
Rail capacity at Laindon and Stanford-le-Hope |
The 2023 Initial Proposals listed "stakeholder engagement with National Rail and C2C" as work to be done before allocation |
No published record of any engagement |
3.6; 5.3 |
Anglian Water |
Sewerage undertaker; the site has no sewer |
Consultation on 5,000 homes; confirmation of capacity at the receiving works |
Data given to the Council's consultants for an unpublished Water Cycle Study; no capacity confirmation or site assessment for SS18; no statement of common ground (reply of 12 October 2026) |
4.6; 5.3 |
Essex and Suffolk Water |
Water supplier |
Its Water Resources Management Plan allows for 19,460 homes in Thurrock |
The plan provides 25,406; the Council called the company's assumptions "overly optimistic" in 2023, then relied on them; no statement of common ground |
5.3 |
Essex Police; Essex County Fire and Rescue |
Emergency services for a new town |
Funded facilities |
Listed as "Unfunded" in the IDP (£21.0 million and £11.8 million) |
5.3 |
Southend-on-Sea and Medway |
Neighbouring authorities |
Southend welcomed Lower Langdon for its own unmet need; the Council told Medway it meets its own need |
No statement of common ground records any agreement to meet another authority's need |
5.5; 7.5 |
The detail, body by body:
-
Basildon Borough Council objected to Lower Langdon at Regulation 18 (IP0024) and asked to be engaged. That objection is unresolved and most of Langdon Ridge SSSI lies in Basildon.
-
Essex County Council (IP0104) asked to be "fully engaged in the further evolution of proposals". The roads north of the boundary that carry the settlement's traffic to Basildon and Laindon are its roads, and no published assessment of them exists.
-
Natural England's two Regulation 18 requests (IP0173, IP0179) were answered with promises that were not kept (section 4.6), and Natural England "holds no records of any engagement" with the Council on the plan since 1 January 2023, including any statement of common ground or request for one [137].
-
National Highways agreed the Council's traffic model and was never consulted on the allocation the model was run for. It has assessed none of the junctions and will not take on the A13 (section 5.3).
-
Historic England was not consulted on SS18 and has not seen the Heritage Impact Assessment that finds harm which "should be avoided" (Appendix E, E4).
-
Mid and South Essex NHS Foundation Trust was not consulted.
-
c2c and Network Rail were not engaged.
-
The Environment Agency, operating authority for the Main River through the site, holds no record of any consultation on the allocation before Regulation 19 (9 October 2026; Appendix E, item E7). Its Regulation 18 advice, that built development should avoid the site's watercourses and flow paths, that risk to Corringham and Stanford-le-Hope downstream must not be increased, and that the new SFRA should provide the evidence for considering this site, was not carried into the plan or its evidence.
-
Southend-on-Sea City Council was the only neighbouring authority to welcome Lower Langdon at Regulation 18, and did so as a place to meet its own unmet need: "Southend will have a considerable amount of unmet need in its own local plan to 2040". The Council recorded it as "support for the proposed New Places", without the reason Southend gave.
-
The Council told Medway Council, the unitary authority on the Kent side of the Thames estuary, that it expected to meet its own need within the borough. No statement of common ground records any agreement to take another authority's need. Rochford and Thurrock both "recognised the potential impact of ... Thames Freeport on future housing demand" across South Essex, which the plan assumes lands wholly in Thurrock (Appendix G; Regulation 18 Consultation Statement [7]).
-
Essex and Suffolk Water, the water supplier, and Anglian Water, the sewerage undertaker, have no statement of common ground on a plan that exceeds the one's supply allowance by 5,946 homes and sends its sewage to the other's overflowing works.
-
At Cabinet on 26 August 2026 a member asked "if the infrastructure can keep up with the planned growth". The recorded answer concerned a Section 106 board and a future Community Infrastructure Levy, not capacity (Cabinet minutes [6]; Regulation 18 Consultation Statement [7]).
5.6 Ground E6: no delivery mechanism, no trigger, and forecasts built on the wrong data
Delivery mechanism. Policy SS18 paragraph 9 says the Council "will consider using a delivery vehicle". There is no delivery vehicle, no compulsory purchase costing, no land assembly evidence, and one landowner with "total control of the site" (Viability Assessment [29] 8.68).
The Council is under Best Value Commissioner intervention until at least 30 April 2028. That is context, not a ground, but it bears on who carries the risk if developer contributions do not materialise. The plan does not say.
Traveller pitches. Policy SS18 requires 20 serviced Gypsy and Traveller pitches inside a site that, on the promoter's own account, delivers nothing in the first five years from adoption (to about 2033) and on the plan's trajectory reaches 600 homes by 2033/34. The Gypsy and Traveller Accommodation Assessment [40] identifies a five-year need of 140 pitches against 43 deliverable. Pitches placed inside SS18 are pitches the plan will not deliver when they are needed.
Monitoring. The plan's monitoring framework (its Appendix 1) has no trigger for the failure of either new settlement and gives Strategic Policy 1 "no separate indicators". If SS18 slips, nothing in the plan responds. And it is slipping before the plan is adopted: the Council's own viability study records that the promoter "was not expected" to deliver in the first five years, that "discussions have since stalled" and that the promoters "are seeking a development partner" (section 5.1), so the first indicator the framework lacks is one the Council's own evidence has already tripped.
Forecast inputs. The site transport assessment [14] derives its trip generation from 2011 census data for a single rural output area applied to a town of 5,000 homes. Its rail trip rate of 0.088 per dwelling is the rate used for areas "with good access to public transport", for a site with no station. The commuting ratio behind the housing figure is a single 2021 value the consultant calls "skewed" by the pandemic. The plan-wide junction models are run for a scenario named "2044 Plan B".
The capacity study's density range is 30 to 70 dwellings per hectare in one section and 30 to 100 in another.
The appraisal text for SS18 contains landscape wording copied from the West Horndon appraisal, describes the SSSI as "forming the north part of the site boundary" on one page and "at the southern tip of the site" three pages earlier, and refers to a "Streamside Wood" that appears in no register.
The site appears under four names across the evidence base ("Lower Langdon", "Land north of Stanford le Hope", "North Stanford" 96 times in the 2023 appendices, and "New settlement north of the A13").
Individually these are errors. Together they show an evidence base assembled without site visits and not reconciled, which is the pattern the Inspector will find throughout SS18.
Costs that do not reconcile. The One Tree Hill bridge over the A13 is priced at £15,000,000 in the Rough Order of Cost Estimate [39] and £22,500,000 in the IDP schedule, exactly 1.5 times, with no explanation in either document. The Rough Order of Cost's Lower Langdon transport figure of £152,600,000 is built from "limited" design "varied in detail", with "no engineering details or proposals", and lists among its basis of information a "Screenshot of Figure 6-6 provided by I Varney via Teams meeting held 08.01.2026".
The IDP records that the costs "each include a 20% contingency" which "does not consider developed risk assessments, budget management coverage, optimism bias and the like", and that "relevant adjustments to project cost estimates should be made" for optimism bias. None has been made. (Appendix J; Rough Order of Cost Estimate [39]; IDP [30])
5.7 Ground E7: the August 2026 national decision-making policies make the allocation undeliverable as planned
The plan is examined against the December 2024 NPPF [74], but every planning application on the allocation will be decided under the national decision-making policies in force since 17 August 2026. Those policies set refusal as the expected outcome for the development the allocation requires, and an allocation that cannot be permitted as planned is not deliverable. In summary: even if the allocation survives examination, the rules every application must then satisfy (an appropriate assessment that does not exist, refusal where ancient woodland is lost, the Golden Rules' 50 per cent affordable housing on Green Belt land, works in or affecting a SSSI) leave a developer facing a site that cannot be consented as drawn and cannot pay for itself if it is. A site of this size, with sustained local and statutory objection in prospect, is one no developer can bring forward at the pace the plan assumes.
• Policy N6(1)(b) and N6(3): a proposal affecting a SSSI, on land inside or outside it, "should only be supported if there would be no adverse effect (either individually or in combination with other developments) on the site's features of special scientific interest", or the benefits clearly outweigh the impact, or an Environmental Delivery Plan covers it. No assessment of the effect exists. Natural England's recorded position is adverse.
• Policy N6(2): development entailing "the loss or deterioration of irreplaceable habitats (such as ancient woodland ...) should be refused, unless there are wholly exceptional reasons and a suitable compensation strategy exists". The £3 million Laindon Road link is such a development.
• Policy N6(1)(a): development affecting a habitats site "should be refused unless an appropriate assessment has concluded that the proposal will not adversely affect the integrity of the site". The plan-level assessment does not cover SS18. No application could rely on it.
• Policy GB8 (Golden Rules): affordable housing at the plan's Green Belt requirement or, until one exists, 15 points above the highest existing requirement, capped at 50 per cent. Contributions "significantly below" the rule are acceptable "only in exceptional cases where fully evidenced and justified". The Council's evidence finds the site unviable at 35 per cent.
• Annex A paragraph 2: adopted plan policies "materially inconsistent" with the national policies receive "very limited weight".
The control an allocation is said to give the Council is smaller than members were told. (Working note on the August 2026 Framework, sections 3 and 5, held in the evidence repository, available on request.)
5.8 Ground E8: the policy's own requirements do not fit on the land
Section 4.4 sets out the land budget.
The point is repeated under the effective test because a policy whose requirements cannot be accommodated on the allocated land is not deliverable as written. Twenty hectares of employment land against a 6.4-hectare non-residential allowance, three schools, 32 hectares of open space, about 14 hectares short, 20 Traveller pitches, and a SANG with no land allocated to it, on which the whole SSSI mitigation case rests. Those are the policy's own requirements. The constraints the Council's own policies and the national standards then add take the land budget lower still, and with it the affordable housing. On the Council's own capacity figures the homes fall from 3,841 to 3,223 with the drainage land Policy DMP29 requires, 3,085 with the buffer to Fell-me-down Shaw (ancient woodland), 2,911 with the SSSI buffer, 2,861 with the Lodge Hall Shaw buffer, 2,734 with the A13 noise bund, and 2,126 with the SANG to Natural England's standard.
The affordable housing the site can carry falls in step, from 17 per cent to 5 with the drainage land, to 2 with the ancient woodland buffer, and to none from the SSSI buffer onward (section 4.4; section 5.2, Figure 6; Appendices I and J). A policy that promises 35 per cent affordable housing on land that can carry none is not deliverable as written.
The Corringham Park Farm parcel reaches 1,000 homes only by cutting ecological land to 2 per cent, drainage to 2 per cent and community facilities to nil. A developer will build what fits and negotiate away the rest. The plan provides no mechanism to prevent it, and the plan's monitoring framework (its Appendix 1) has no trigger for the failure of either new settlement.
6. Consistent with national policy
The plan is examined against the NPPF of December 2024 (NPPF August 2026 [75], Annex A paragraph 8). Policy SS18 is inconsistent with it in the following respects, each set out above and cross-referred here.
6.1 Green Belt (chapter 13)
The allocation fails the Framework's Green Belt chapter at each of its steps:
-
Exceptional circumstances (paragraph 145) are not "fully evidenced and justified" for this site (section 4.1).
-
Other reasonable options (paragraph 146) were not examined before release, or not on the record: no urban capacity or brownfield study, no density test beyond 35 dwellings per hectare or the prevailing density, no justification of the windfall allowance, no record of discussions with neighbouring authorities.
-
The release sequence (paragraph 148) was not followed: the land is neither previously developed nor grey belt, and the plan's own strategy (paragraph 6.8.3) is to release grey belt.
-
The grey belt definition (Annex 2) excludes land that strongly contributes to purposes (a), (b) or (d) and land where the policies for footnote 7 assets, including SSSIs and irreplaceable habitats, "would provide a strong reason for refusing or restricting development". The Council's consultant found the first limb fails for CS-01 and did not complete the second for any sub-area (Stage 2 GBA [12], page 59).
-
Safeguarded land (paragraph 149(c) and (d)), not allocation, is the route for land wanted after the plan period. The plan allocates 1,600 SS18 homes after 2044.
-
The Golden Rules (paragraphs 156 to 157; paragraph 67) expect 50 per cent affordable housing on land released from the Green Belt unless that would make development unviable. The Council's evidence says it does, and the plan sets 35 per cent without saying so.
6.2 Habitats, SSSI and biodiversity (chapter 15)
Plans should identify, map and safeguard the components of local wildlife-rich habitats and ecological networks, including the hierarchy of designated sites, wildlife corridors and stepping stones, and promote the conservation of priority habitats and species (paragraph 192(a) and (b)).
Development likely to have an adverse effect on a SSSI, alone or in combination, should not normally be permitted (paragraph 193(b)).
Development resulting in the loss or deterioration of irreplaceable habitats should be refused save in wholly exceptional circumstances (paragraph 193(c)). Against those policies the record is as follows:
-
The whole allocation lies inside the SSSI's Impact Risk Zone. The Council never applied the IRZ.
-
The Council's appraisal identified the risk (IIA [8] 4.80: "potential to adversely affect ... Langdon Ridge SSSI") and then no assessment of the effect on the SSSI was made: no survey, no visitor or carrying-capacity study [14], no lighting, noise or air assessment, no consideration of the SSSI's notified features or of the recreational-disturbance pressure Natural England has recorded on it since 2019, no response to Natural England's Regulation 18 request for "additional assessment ... of impacts".
-
The Site Selection Methodology [37] gave the ecological network no weight, omitted Impact Risk Zones and treated priority habitat as information only.
-
The SANG on which the policy's mitigation rests has no area, location or cost.
-
The plan costs a road through ancient woodland inside the SSSI, and its only layout sends the settlement's traffic and its residents into the SSSI by the lanes along its boundary.
-
Fell-me-down Shaw, inside the allocation, is now confirmed ancient woodland, an irreplaceable habitat the layout surrounds with housing.
-
The plan-making authority's own duties under section 28G and section 40 (section 3.4) were not discharged.
6.2a Green Belt, the value of this land
The consistency test on Green Belt is not only procedural. The Council's own assessment gives this land the highest Green Belt value in the borough: CS-01 scores 5 out of 5 on purpose (b), preventing neighbouring towns merging, the only sub-area of 145 assessed to do so, and 4 out of 5 on purpose (c), safeguarding the countryside. Its strategic parcel is rated Major, Major and Fundamental for harm. It "forms a substantial part of the gap between Corringham and Basildon". It is one of only eight sub-areas in the borough that are not provisionally grey belt, where 137 of 145 are (Stage 2 GBA Tables 26, 28 and 32).
The NPPF's release sequence puts such land last. The plan's own Green Belt strategy says it targets grey belt. The plan released it as though it came first in the sequence, and gave no reason. The 2023 appraisal said the same in its own words: the land "prevents Stanford le Hope and Langdon from merging". [Stage 2 GBA pages 52, 62, 70; Appendix 4.5 [13] pages 2 to 5]
6.3 Flood risk (chapter 14)
Inappropriate development in areas at risk of flooding should be avoided by directing development away from the areas at highest risk. Where development is necessary in such areas it should be made safe for its lifetime without increasing flood risk elsewhere. The sequential and exception tests apply at plan-making (paragraphs 170 to 172 and 177 to 179).
Housing is not permitted in Flood Zone 3b. The Council's own Level 2 assessment records Flood Zone 3b on the site, says it "should be retained as floodplain", and says modelling "should be undertaken". The exception test was passed by restating the allocation. The assessment is an unapproved draft. The capacity study on which the 4,041 figure rests does set back Flood Zones 2 and 3 (by 10 and 15 metres) from the land it counts as developable, but it draws them from national mapping, which does not show Flood Zone 3b at all, so the functional floodplain the Council's own assessment says should be kept as floodplain has never been drawn on the layout. The drainage the development needs is 19 to 25 hectares of basins on this representation's model against the 6.4 the Council allows, and must sit on the same low ground beside the Main River that the flood zones occupy, so the land the study counts as excluded and the land the drainage needs are largely the same land, counted once as a constraint and never as a cost (section 4.6; Appendix O).
6.4 Historic environment (chapter 16)
The Council's own heritage consultant rates the site "Moderate Adverse ... should be avoided" for the setting of the Horndon on the Hill Conservation Area and four listed buildings. The weighing of less than substantial harm against public benefit that the NPPF requires (paragraph 215), after giving great weight to the assets' conservation (paragraph 212), does not appear in the plan or the IIA. Nor was the Government's adviser asked: Historic England expected site heritage assessments "ahead of the Regulation 19 plan" and the Council promised one, but Historic England has confirmed in writing that it has no record of being consulted on SS18 before the Regulation 19 plan and has not seen the assessment that found the harm (Appendix E, item E4; section 4.6, Heritage). A harm the Council's own consultant says should be avoided was neither weighed nor put to the statutory consultee.
6.5 Transport (chapter 9)
Development should only be prevented or refused on highways grounds where the residual cumulative impacts would be severe (paragraph 116). The corollary at plan stage is that the plan should identify and cost the infrastructure needed to avoid severe impacts.
The Council's assessment models junctions over capacity and proposes 'monitoring'. Significant development should be focused on locations which are or can be made sustainable through limiting the need to travel and offering a genuine choice of transport modes (paragraph 110). The Council's own appraisal found this location "less sustainable in terms of transport" than the alternative without it, and the site's walking route to the station is severed by the A13.
6.6 Housing (chapter 5)
The standard method is the starting point for need. A higher requirement must be justified by evidence (paragraph 62 and Planning Practice Guidance [76]). The plan's uplift rests on a hand-adjusted jobs scenario its own consultant describes as a choice (section 4.5). Plans should identify a supply of specific, deliverable sites for years one to five and developable sites for years six to fifteen (paragraph 72). SS18 is neither, on the promoter's own account (section 5.1).
6.7 Plan-making (chapter 3)
Plans should be prepared positively, in a way that is aspirational but deliverable, and should be underpinned by relevant and up-to-date evidence that is adequate and proportionate (paragraphs 16 and 32). The Procedure Guide [77] (paragraph 1.1) requires the plan to address the necessary matters "and not defer them to future updates or rely on the Inspector to deal with them". Policy SS18 defers survey, flood modelling, drainage strategy, SANG specification, access design and the delivery vehicle to a masterplan after allocation.
What is deferred is not detail to be arranged later. The allocation lies wholly inside the Impact Risk Zone of a SSSI it abuts for the length of its northern edge. The only layout drawn for it sends thousands of vehicle movements a day through that SSSI by the lanes along its boundary and costs a road through its ancient woodland. The fields themselves carry Red List birds, legally protected species and an ancient wood of their own, none recorded by the Council. Those are the matters on which the allocation stands or falls, and the plan leaves every one of them to be found out after the land is allocated.
7. Positively prepared
The test (NPPF paragraph 36(a)): a plan is positively prepared if it provides "a strategy which, as a minimum, seeks to meet the area's objectively assessed needs; and is informed by agreements with other authorities, so that unmet need from neighbouring areas is accommodated where it is practical to do so and is consistent with achieving sustainable development".
7.1 The objectively assessed need is met without Policy SS18
The objectively assessed need is the standard method figure: 21,480 homes over 2024 to 2044 (plan paragraph 4.2.2). Table 2 (page 43) gives supply within the plan period of 25,406.
The plan's own Appendix 2, the housing trajectory (page 415), gives SS18's contribution within the period as 3,400 (600 plus 1,300 plus 1,500). Without SS18, supply within the period is 22,006: 526 homes above the objectively assessed need. And in the first five years, when the need is most pressing, SS18 delivers nothing on the Council's own trajectory and nothing on the promoter's own account (section 5.1), so the sites the plan does not take forward are the only ones that can help where help is needed.
If the Inspector considers a margin of 526 homes too thin, the Council's own evidence holds the replacement without greenfield Green Belt. Matching every site in HLAA Appendix 4 [15] to the plan's allocations (by the IIA's own site references [8], paragraphs 6.100 to 6.424) gives [124]:
• 646 homes on 11 sites outside the Green Belt that the plan does not allocate, without planning permission and of 10 or more homes (so not already counted as commitments or windfall). The largest is 304 homes east of Broxburn Drive, South Ockendon, a Council-led brownfield scheme with "No significant constraints" (HLAA page 15).
• 527 to 1,444 homes on two to four sites of previously developed land in the Green Belt that the plan does not allocate (HLAA pages 18, 34, 35, 39), which national policy places ahead of any greenfield release.
With these, supply within the period without SS18 is 23,179 to 24,096 homes, 7.9 to 12.2 per cent above the objectively assessed need. Both sources come before SS18 in the release sequence (paragraph 148): SS18 is Green Belt and not grey belt.
The Council's February 2026 Heritage Impact Assessment [36] also lists as allocation "SS14" a site of 1,559 homes north-east of South Ockendon (HLAA site 60915) that does not appear in the Regulation 19 plan. The Habitats Regulations Assessment [11] still lists it as Policy SS14, and the IIA's summary of policy effects [8] still appraises it, so it was removed after both were drafted. No document records why.
The published evidence points to two possible reasons: the Heritage Impact Assessment (HIA) rated it Major Adverse for both built heritage and archaeology (South Ockendon Hall's moat and a scheduled monument), and the HLAA records Lower Thames Crossing land take within it.
SS18 was kept at Moderate Adverse on heritage, and it carries the SSSI, flood and Green Belt findings set out above.
The point is that the Council compared these sites and recorded no reasons, not that South Ockendon should be built. The figures are the HLAA's whole-site working capacities, not trajectories. They show that the land exists on the Council's own evidence.
7.2 The plan identifies 14,426 more homes than the need requires and cannot justify it
The plan identifies land for 35,906 homes, 67 per cent above the objectively assessed need. Its justification is the 28,880 requirement, which is a local choice resting on a jobs scenario the Council's own consultant describes as one the Council "may" adopt "if it chooses" and which "would not be necessary" for baseline growth (HNA [41] 4.9, 4.20), calibrated to 31,166 jobs the plan never states, on a Freeport that has so far produced about 1,600 jobs across its three boroughs [97].
Between 2015 and 2024 the borough added about 15,000 jobs and 5,101 net additional homes (section 4.5). The jobs the plan expects arrived in the last decade with about two fifths of the homes it now says they need. The plan's housing requirement rests on an unsupported assumption, that each new job needs a new home in the borough, and this representation tested that assumption against the Council's own ten years of jobs and homes data: the record shows no relationship of the kind the requirement needs, and applying the Council's own method to the Council's own record gives about 10,600 homes, not 28,880 (section 4.5; Appendix G).
The Council did not run that test, and the national record shows that only two councils in England have sustained, over twenty years, the rate of growth the requirement demands (section 4.5). A plan that meets the assessed need is positively prepared. A plan that allocates 250 hectares of the borough's highest-value Green Belt to pursue a self-set target 34 per cent above need, and then fails to meet that target within its own period anyway (25,406 against 28,880), is not seeking to meet needs "as far as possible". It is seeking a number.
7.3 Infrastructure needs
Policy SS18 adds a settlement whose infrastructure is calculated for 4,000 homes, funded by contributions from a site the Council's evidence finds unviable, and confirmed by no provider (section 5.3). It does not help the plan meet infrastructure needs. It creates 12,000 people's worth of unfunded need. It adds 3,400 in-period homes to a plan already 5,946 homes above what the water company planned to supply, and 12,000 people to a sewage works whose inlet overflow already spills because the sewers lack capacity (section 5.3).
7.4 Environmental needs
The Council's own appraisal found the strategy without SS18 better on biodiversity, landscape, heritage, water, flood, air and climate (IIA [8] 4.73 to 4.80). The Council's statutory adviser on nature said the site should not be taken forward until alternatives had been fully considered. A plan that includes SS18 works against the environmental needs the same plan is required to serve. Those needs are not optional. The Council is under a statutory duty to take reasonable steps, consistent with the proper exercise of its functions, to further the conservation and enhancement of the SSSI's notified features (section 28G of the Wildlife and Countryside Act 1981) and to conserve and enhance biodiversity (section 40 of the Natural Environment and Rural Communities Act 2006). It cannot discharge either duty for land it has never surveyed, beside a SSSI whose condition Natural England last assessed in 2018, and its own biodiversity evidence is a Biodiversity Action Plan written for 2007 to 2012, which the IIA itself notes relies on a national framework archived in 2012 (IIA 2023 Appendices, B.179, page 83). The Council does not know what lives on this land, and the document it would use to find out is fourteen years out of date. On this record the Council cannot show that it has discharged either duty in allocating this land.
7.5 Cross-boundary needs
The plan has not been prepared with regard to what neighbouring authorities are providing. Basildon Borough Council, whose boundary the allocation touches and in which most of Langdon Ridge SSSI lies, is under Government direction to submit a plan by 31 December 2026, and its Government target could require it to provide about 28,000 homes, including Green Belt sites on the same side of the borough. Across the A127, Brentwood Borough Council has resolved to grant outline permission for up to 3,700 homes at Dunton Hills Garden Village (21/01525/OUT), and Natural England asked the Council in February 2024 to assess its cumulative effect on the SSSI together with West Horndon (section 3.1).
Basildon objected to Lower Langdon at Regulation 18 and asked to be engaged. No statement of common ground exists. No assessment of the cumulative effect of Thurrock's two new towns and Basildon's Green Belt sites on the same A13 corridor, the same hospital, the same railway and the same SSSI has been made by either authority.
Thurrock's 28,880 has not been tested against the housing its neighbours are being required to provide or against any sub-regional need. Nor has SS18 been assessed in combination with the plan's own allocations around it: about 2,261 homes at Corringham, 938 at Stanford-le-Hope and 116 at Horndon-on-the-Hill, with infill at Fobbing (plan Table 1, page 33), on the same A13 junctions, the same station, the same hospital, the same sewage works and the same SSSI, and across the ridge Basildon's own Green Belt sites and Brentwood's Dunton Hills Garden Village. Some 8,300 homes are proposed for the land between Stanford-le-Hope, Corringham, Horndon-on-the-Hill and Langdon Hills. The IIA scores each allocation alone, the transport assessment models each site's junctions alone, and the HRA, the one document obliged to assess effects in combination, does not contain the site (section 3.1). The one neighbour that welcomed Lower Langdon did so for its own unmet need, a justification the plan does not advance and no statement of common ground supports (section 5.5). (Regulation 18 Consultation Statement [7] IP0024; Basildon direction, 21 July 2026; Echo, 26 August 2026)
8. Why deletion is the right remedy, and why a cure will not work
8.1 The Inspector's choice
The Inspector must give the Council the opportunity to overcome problems where that is possible, usually by "limited additional further work not usually taking more than 6 months", and any change made after Regulation 19 must be subject to sustainability appraisal, Habitats Regulations Assessment [11] and consultation equivalent to the Regulation 19 stage (Procedure Guide for Local Plan Examinations [77], 11th edition, introduction and paragraphs 1.4, 9.1 and 9.3). The question for the Inspector is therefore not only whether Policy SS18 is unsound, which it is, but which of the two available routes, cure or deletion, is consistent with the evidence and the timetable.
8.2 What a cure would require
Each of the two legal defects can be cured only by a consulted addendum.
An HRA addendum would have to screen the allocation, rate it for functionally linked land against the HRA's own criteria, require the wintering, migratory and breeding bird surveys the HRA says are required for such sites, and be put to Natural England, whose recorded position is that the allocation should not be taken forward.
It would also have to replace the water-quality assessment for the whole plan: identify the works that actually receive the plan's sewage, model Tilbury WRC's discharge and storm overflow with SS18 in and out, and find mitigation that exists, for a works whose operator records a capacity problem and no improvement action.
An IIA [8] addendum would have to score the adopted strategy against the strategy without Lower Langdon and give reasons for the choice. The Council's consultants have already scored that comparison and the strategy without Lower Langdon won on eight objectives and lost on none. Both addenda would have to be published for consultation and considered with an open mind (Cogent Land LLP v Rochford District Council [2012] EWHC 2542 (Admin)).
None of that can be done before the Council's intended submission in December 2026, and done during the Examination it consumes the six months the Procedure Guide allows before the Examination itself is at risk. Done on the Council's own evidence, both addenda report what that evidence already says.
8.3 What deletion requires
The modifications in section 2.
No new evidence is needed, because the plan without SS18 is the plan the Council's own appraisal preferred: the Council's consultants scored it, the HRA's seventeen-site scope matches it, and the Green Belt, housing land, heritage and viability findings all point to it.
Supply within the period remains above the standard method minimum. The Corringham Park Farm land returns to the status the HLAA [38] gave it in October 2025.
The land returns to the Green Belt, where the Council's own consultant found it performs strongly and where, not being grey belt, it is protected against the presumption in favour of development that would otherwise apply while the Council's five-year supply is short. The rest of the plan proceeds to adoption on the Council's timetable.
8.4 The requirement
Deleting SS18 reduces supply within the period from 25,406 to 22,006 against the Council's requirement of 28,880. That shortfall exists with SS18 in the plan. SS18 does not close it, and on the promoter's own account it does not begin to close it in the first five years. The position on the Council's own figures is that the requirement is a choice above need, that the plan's own trajectory does not deliver it, and that the site relied on to narrow the gap is the one the Council's evidence finds unviable, unassessed and undeliverable in the five-year window. Section 2 (MM8) sets out the two ways the Inspector can deal with it. Neither requires SS18.
The better course for the borough's housing is the one the Council's own evidence points to: the housing land study holds 17,055 homes on 79 sites it found suitable, available and achievable that the plan does not allocate, 1,014 outside the Green Belt and 1,444 on previously developed land within it, and the allocations already in the plan that are deliverable in the first five years would gain from the infrastructure money, officer time and developer interest that a 5,000-home settlement with no developer absorbs. A plan that expanded what is already showing promise would deliver homes in the years the Housing Delivery Test counts. SS18 delivers none in those years on anyone's account (section 7.1).
8.5 Precedent
Inspectors have removed new-settlement allocations by main modification and allowed the rest of the plan to proceed, and have sent plans back where the appraisal of alternatives or the habitats assessment was found wanting:
• Greater Norwich Local Plan (2024): the Inspectors found Policy 7.6, Preparing for New Settlements, "not justified", there being "no submitted evidence that major new additional sites are required before 2038 or that new settlements should be a favoured option in any case", and deleted it by main modification MM18 (Inspectors' Report, February 2024, paragraphs 85 to 87). The plan was adopted in March 2024.
• North Essex Authorities Shared Strategic Section 1 Plan (2018 to 2021): the Inspector found that the sustainability appraisal's assessments of the alternatives to the garden communities "lack the necessary degree of objectivity and are therefore unreliable" (letter IED011, 8 June 2018). After further appraisal and resumed hearings, his report of 10 December 2020 found two of the three garden communities, Colchester/Braintree Borders and West of Braintree, unsound, and they were deleted by main modification before the plan was adopted in 2021.
• Uttlesford Local Plan (2020): the Inspectors found the three garden communities "not justified and effective", and that the sustainability appraisal did "not consider a smaller number of garden communities, in combination with more housing in existing sustainable settlements" (Inspectors' letter ED82, 10 January 2020 [131]). The Council withdrew the plan.
• Wealden Local Plan (2020): the Inspector found that the Council had not met the duty to cooperate, including in its engagement with neighbouring authorities and Natural England on the effects of the plan on the Ashdown Forest Special Area of Conservation, and that its evidence on those effects was not adequate. The Council withdrew the plan on 19 February 2020. The principle those cases share is that where an allocation rests on an appraisal that did not assess it, or contradicts the authority's own evidence, the proportionate cure is to remove the allocation, not to rebuild the evidence around it.
8.6 What the Council will say, and the answer
A competent authority will make each of the following replies. Each is answered from its own evidence.
Table 8.6. What the Council will say, and the answer.
The Council's likely reply |
The answer |
|---|---|
"An HRA addendum has been commissioned and will be submitted to the Examination." |
It must screen 225 hectares of open arable land inside the estuary's zone of influence for functionally linked land under the HRA's own criteria, require the surveys the HRA says are required, and be put to a statutory adviser whose recorded position is that the site should not go forward. It cannot be done before submission. Done on the Council's own evidence it is evidence for deletion. Regulation 105 does not permit the plan to be adopted with the site in it until it is done. |
"The option-level flood score ignored mitigation; the policy-level score reflects the mitigation the policy requires." |
The mitigation is a drainage strategy that does not exist and that the policy requires to be written after allocation. The Council's own flood assessment says the modelling has not been done. A score cannot rest on a document that has not been written. |
"A buffer between the housing and the SSSI boundary will be secured through the masterplan." |
The harm arises from the settlement's size and its pathways to the SSSI, which a buffer does not change: about 12,000 residents, 1,900 dogs and 1,800 cats within walking distance; traffic on the lanes through SSSI units; light; and the loss of the fields the SSSI's species use. Natural England notified the SSSI as an "archipelago of sites" whose value depends on "the importance of linkage and the avoidance of isolation" ([23], pages 17 to 18). On the Thames Basin Heaths the 400 metre presumption is the floor: avoidance measures apply across a "Zone of Influence" to 5 kilometres, varied only for "physical obstructions to cat, or human movement" ([130], paragraphs 4.2, 4.3 and 4.5). No part of SS18 is more than 2.4 kilometres from the SSSI, and all of Corringham Park Farm is within 400 metres of it. |
"Ecological survey is a matter for the planning application." |
The plan-making authority has its own duties under regulation 105, section 28G and section 40 that fall before allocation; none was discharged. The site has been under consideration since 2023; a records search and a season of survey were reasonably available. National policy requires the evidence for a plan to be proportionate to the decision; for 250 hectares against a SSSI, zero is not proportionate. |
"The HLAA's 50,128 does not mean every site is suitable for allocation; much of it does not fit the spatial strategy." |
Correct, and beside the point. The Council had substantial choice and must show why it chose land its own consultant recommended against over grey belt its own strategy prefers. It has not. |
"The capacity brief was clumsily drafted; the analysis is sound." |
The study assumed developability and was instructed to exceed 4,000. Its own land budget does not accommodate the policy's requirements. Its own finding on Corringham Park Farm is 463. |
"Corringham Park Farm's numbers will be resolved through the masterplan." |
The policy allocates 1,000 and makes the parcel the first phase carrying the settlement's utilities, movement network and SANG. A first phase the Council's own consultant says cannot be built to standard is not a phasing detail. |
"The Green Belt and HLAA assessments looked at each parcel in isolation; as part of a comprehensive new settlement the conclusions differ." |
The grey belt finding is not an in-isolation judgement: CS-01 "scores strongly against one or more of purposes (a), (b) and (d)" on its own merits, and 5 of 5 on preventing towns merging is a finding about the gap, not about the parcel's neighbours. The HLAA's "Unsuitable" was written knowing the site was promoted as part of a larger scheme. And no document records the "comprehensive" reasoning; it is offered now for the first time. |
"Regulation 19 provides a further opportunity to comment, which cures any earlier defect." |
Accepted, which is why consultation is recorded as context and not pleaded as a ground. |
"The site is viable at 34 per cent; the policy will be modified." |
That concedes the plan as published sets a requirement its evidence says the site cannot meet, that the price of the site is about 800 affordable homes, and that the Golden Rules figure any application faces is 50. It does not answer the promoter's delivery statement, the £9.8 million, or who pays. |
"Without the new towns the homes would go to Stifford, Ockendon and Stanford." |
The Council's own Table 2.2 gives the towns identical homes in every sub-option with or without Lower Langdon; Lower Langdon only ever replaces 5,000 at West Horndon; the option without it delivers 37,242 against 36,100. |
"The duty to cooperate no longer applies." |
Accepted. Effective joint working remains a soundness test, and the record shows none with any body. |
"The Minister has asked Inspectors to be pragmatic." |
On proportionality of evidence, viability and deliverability. Not on the statutory requirements, which the letters say are unchanged; and the 2026 letter's own carve-out is a "fundamental obstacle to delivery", which a stalled promoter with no partner and a negative land value is. |
"The water-quality section of the HRA can be corrected by substituting Anglian Water's plans." |
Anglian Water's own 2025 return attributes the Tilbury inlet overflow's 64 spills to "Hydraulic capacity" and records no improvement action; the permit sets no nutrient limit; its Drainage and Wastewater Management Plan's strategy for Tilbury to 2035 is to "increase attenuation". Substitution produces an assessment of a works already failing, with SS18's 12,000 people to add. |
"The homes meet sub-regional need." |
The plan does not say so, the Council told Medway it meets its own need, and no statement of common ground records any agreement. The only neighbour to welcome Lower Langdon, Southend, wanted it for Southend's shortfall. |
"With a delivery vehicle the requirement can be delivered." |
Only two councils in England have sustained the required rate of growth over twenty years; no Essex council has built 1,444 homes in any single year; Thurrock's best decade is 567 a year. There is no delivery vehicle, only a policy that the Council "will consider" one. |
"Water supply and sewerage are matters for the water companies." |
The water company planned for 19,460 homes in Thurrock and says its Essex zone is in deficit from 2025; the plan provides 25,406 in its period. The Council told the water company in 2023 that its figures were too low and its demand assumptions over-optimistic, and now relies on them. Infrastructure the plan's own evidence says is required, and that no provider has agreed, is a plan matter (NPPF paragraphs 20, 26 and 27). |
8.7 Section 20 certification and the Ministers' letters
On submission the Council must certify that it has complied with the legislative requirements and "thinks the document is ready for independent examination" (PCPA 2004 section 20(2)).
The Minister's letter to the Planning Inspectorate of 30 July 2024 says an authority "should not be submitting for examination a deficient plan believing the Inspector will use significant time and resource during the examination to 'fix' it".
The letters of 8 October 2025 and 15 July 2026 ask Inspectors to be pragmatic on the proportionality of evidence, viability and deliverability for plans under the old system. They do not alter the statutory requirements, and the 2026 letter's own carve-out is a "fundamental obstacle to delivery".
A Council now on notice that its HRA does not assess SS18, that its IIA never appraised the strategy adopted, and that its promoter does not expect to deliver in the first five years, cannot certify the policy without qualification. The December resolution is the Council's opportunity to submit on time with SS18 flagged for deletion. This representation is the record of why it should.
8.8 What is not asked for
This representation does not ask for the plan to be withdrawn or found unsound as a whole. A borough without an adopted plan is exposed to development by appeal and to Government direction, as Basildon's position since July 2026 shows. The plan without Policy SS18 is a plan that can be adopted in 2028. That is the outcome sought.
9. Participation in the hearing sessions
I wish to participate in the hearing sessions on the matters raised in this representation. My participation is necessary because:
• This representation contains analyses the Council's evidence base does not: a flood and drainage model of the site built from the Environment Agency's own data, a land budget on the Council's own capacity figures, a rebuild of the Council's own viability appraisals to the pound, a noise assessment from the Government's own maps, a test of the jobs and homes assumption against ten years of the Council's own data, a reconstruction of the Council's site scoring, and species records from the land itself (Appendices G to Q). Each has a stated method, data and limits, and each can be examined and challenged only with its author present.
• I am the representor with first-hand, long-term ecological knowledge of the allocation and its interface with Langdon Ridge SSSI, and the one with species records from the site itself (Appendix D), which the Council has never gathered and which bear directly on the habitats and biodiversity grounds.
• The northern access proposals in the Infrastructure Delivery Plan [30] run onto the road on which I live. No resident of South Avenue or Old Hill Avenue has been consulted, and the Inspector will need evidence of what those roads are. Photographs B1 to B18 (Appendix B) show them.
• The grounds in sections 3 to 5 are built on a page-referenced reading of the whole evidence base, held in a repository offered to the Examination and available on request. I can answer the Inspector's questions on where each finding sits in the Council's documents.
• The independent ecological survey described in section 1 will be in progress during the Examination. I will offer its results, with their methods and raw data, as they become available.
• I intend to submit written statements on every matter, issue and question that concerns Policy SS18, the Habitats Regulations Assessment or the sustainability appraisal, to respond to any addendum to either, and to respond to any main modification affecting Policy SS18, including any that would retain it in modified form. Each of the findings sought at section 3.6 is a matter on which I ask to be heard.
Appendix A. Numbered list of documents relied on
Every document is cited in the text by its number in square brackets at its first mention in each section, and in full here. Items 1 to 73 are the documents held in the evidence repository (section 9): for each, the publisher, date, source URL and the pages relied on. The SHA-256 hash of each file as retrieved from the Council's or the publisher's website, which allows anyone to confirm that the file examined is byte-for-byte the file the Council published, and the repository path of its extracted text are in the repository manifest (evidence/manifest.csv), available on request. Items 74 onward are legislation, policy, guidance, case law and other public sources.
[1] Thurrock Local Plan 2024-2044 Regulation 19 Publication version (low resolution)
Thurrock Council, 2026-08. Pages relied on: 291-295 Policy SS18; 330-332 DMP23 and DMP24; 357-362 DMP39; 32-35 SP01. Source: link
[2] Thurrock Local Plan Reg 19 Policies Map August 2026
Thurrock Council, 2026-08. Source: link
[3] Thurrock Local Plan Reg 19 Publication High-Res (link stub; open in a viewer and follow the hyperlink)
Thurrock Council, 2026-08. Source: link
[4] Thurrock Local Plan 2024-2044 Regulation 19 Version (Cabinet report)
Thurrock Council, 2026-08-26. Source: link
[5] Cabinet decision notice 26 August 2026
Thurrock Council, 2026-08-26. Source: link
[6] Cabinet printed minutes 26 August 2026
Thurrock Council, 2026-08-26. Source: link
[7] Thurrock Local Plan Initial Proposals Regulation 18 Consultation Report 2026
Thurrock Council, 2026. Source: link
[8] Thurrock Local Plan Integrated Impact Assessment July 2026
Thurrock Council and consultants, 2026-07. Pages relied on: 47 and 49 and 68; 400-404 Policy SS18 appraisal. Source: link
[9] Thurrock Local Plan Integrated Impact Assessment Appendices July 2026
Thurrock Council and consultants, 2026-07. Pages relied on: 209 scoring method; 435-441 Lower Langdon as a rejected option. Source: link
[10] Thurrock Local Plan Integrated Impact Assessment Non Technical Summary July 2026
Thurrock Council and consultants, 2026-07. Source: link
[11] Thurrock Local Plan Habitats Regulations Assessment July 2026
LUC for Thurrock Council, 2026-07. Pages relied on: 6-7; 26-30 policy list; 53-54 buffers; 83-95 birds; 285 SS18 entry. Source: link
[12] Thurrock Stage 2 Green Belt Assessment February 2026
Arup for Thurrock Council, 2026-02. Pages relied on: 25-26 rating definitions. Source: link
[13] Stage 2 Green Belt Assessment Appendix 4.5 Corringham and Stanford-le-Hope
Arup for Thurrock Council, 2026-02. Pages relied on: 2-5 sub-area CS-01. Source: link
[14] Transport Assessment Lower Langdon Site Specific Assessment August 2026
Thurrock Council, 2026-08. Source: link
[15] Thurrock Housing Land Availability Assessment Appendices 2-4 Site Assessments October 2025
Thurrock Council, 2025-10. Pages relied on: Appendix 3 Unsuitable Sites; site 60893; Appendix 4 Suitable Sites, all rows (replacement supply, section 7). Source: link
[16] Thurrock Landscape Sensitivity and Capacity Analysis May 2026
Thurrock Council, 2026-05. Source: link
[17] Thurrock Open Space Assessment February 2026
Thurrock Council, 2026-02. Source: link
[18] Thurrock Local Wildlife Sites Register 2022
Place Services for Thurrock Council, 2023-12. Pages relied on: entries Th44 to Th69. Source: link
[19] Thurrock Local Wildlife Sites Review 2022
Place Services for Thurrock Council, 2023-12. Source: link
[20] Thurrock Rural Settlement Assessment Fobbing
Thurrock Council, 2023-12. Source: link
[21] Langdon Ridge SSSI citation
Natural England, 2018-06-29. Source: link
[22] Langdon Ridge SSSI views about management
Natural England. Source: link
[23] Langdon Ridge SSSI supporting information
Natural England, 2019-06-29.
[24] Thames Estuary and Marshes Ramsar Information Sheet UK11069
JNCC. Source: link
[25] NECR631 North Thames Estuary and Marshes breeding bird survey 2024
Natural England, 2024. Source: link
[26] Greater Essex Local Nature Recovery Strategy
Essex County Council, 2025-07-10. Pages relied on: Local Habitat Map. Source: link
[27] Bat Surveys for Professional Ecologists Good Practice Guidelines 4th edition
Bat Conservation Trust, 2023-09. Pages relied on: chapters 8 and 10. Source: link
[28] Biodiversity Enhancement Strategy Moores Avenue Fobbing
Johnnie Johnson ACIEEM, 2026-06-13. Source: link
[29] Thurrock Local Plan and CIL Viability Assessment June 2026 (main report; text extracted pages 1-178 of 1255)
AspinallVerdi for Thurrock Council, 2026-06-30. Pages relied on: PDF 8-20 summary; 165-166 Lower Langdon; 168-172 strategic site table and limitations. Source: link
[30] Thurrock Infrastructure Delivery Plan July 2026
Arup for Thurrock Council, 2026-07. Pages relied on: 76-77 water; 118 acute health; 123-124 GP capacity; 166-183 conclusions and costs. Source: link
[31] IDP Schedule Part 2 of 4 Lower Langdon
Arup for Thurrock Council, 2026-07. Source: link SHA-256: e84b868d0d154c7f32c6de71373dda886c8ae201f9bfc05420505a22463d6690.
[32] Thurrock Local Plan Transport Assessment August 2026
Arup for Thurrock Council, 2026-08-12. Pages relied on: PDF 18-32 impact assessment and conclusion. Source: link
[33] Thurrock Strategic Transport Model Forecasting Report June 2026
City Science for Thurrock Council, 2026-06. Pages relied on: PDF 20 and 24-25 and 79-81. Source: link
[34] Thurrock Level 2 Strategic Flood Risk Assessment February 2026 DRAFT (main text only; appendices not published)
AECOM for Thurrock Council, 2026-02. Pages relied on: all 15 pages. Source: link
[35] Flood Risk Sequential Test Methodology July 2026
Thurrock Council, 2026-07. Pages relied on: all 11 pages. Source: link
[36] Thurrock Heritage Impact Assessment Housing Sites February 2026
Thurrock Council (Place Services), 2026-02. Pages relied on: rows 60940 60893 60913 and all Major or Moderate Adverse rows. Source: link
[37] Thurrock Local Plan Site Selection Methodology July 2026
Thurrock Council, 2026-07. Pages relied on: all 19 pages. Source: link
[38] Thurrock Housing Land Availability Assessment October 2025 (main report)
Thurrock Council, 2025-10. Pages relied on: all 5 pages. Source: link
[39] Thurrock Local Plan Rough Order of Cost Estimate 18 May 2026 Revision 06B
Gardiner and Theobald for Thurrock Council, 2026-05-18. Pages relied on: executive summary; basis of information; section 3.12 Lower Langdon. Source: link
[40] Thurrock Gypsy and Traveller Accommodation Assessment and Pitch Delivery Assessment March 2026 updated July 2026
Opinion Research Services for Thurrock Council, 2026-03. Pages relied on: PDF 10-12 need; 60-62 deliverability. Source: link
[41] Thurrock Housing Needs Assessment June 2025
Turley for Thurrock Council, 2025-06. Pages relied on: PDF 3-5 executive summary. Source: link
[42] Thurrock Economic Development Needs Assessment August 2025
Consultants for Thurrock Council, 2025-08. Pages relied on: paragraphs 4.30 to 4.33 and 4.48, Table 4.9. Source: link
[43] Thurrock Water Cycle Study Scoping Report March 2024 (no detailed Water Cycle Study has been published)
AECOM for Thurrock Council, 2024-03. Pages relied on: PDF 26-27 treatment works headroom; 42 Lower Langdon row. Source: link
[44] Stage 2 Green Belt Assessment Appendix 4.1 to 4.4 Aveley Bulphan Chadwell St Mary
Arup for Thurrock Council, 2026-02. Pages relied on: sub-areas AV-01 and BP-04 to BP-13 and CH-03 CH-06 CH-07. Source: link
[45] Stage 2 Green Belt Assessment Appendix 4.6 to 4.10 East Tilbury Horndon on the Hill London Gateway North Stifford (also contains OK sub-areas)
Arup for Thurrock Council, 2026-02. Pages relied on: sub-areas OK-04 OK-07 OK-09 ET-02 ET-11. Source: link
[46] Stage 2 Green Belt Assessment Appendix 4.11 to 4.15 Orsett Purfleet Southfields Thurrock Core Tilbury
Arup for Thurrock Council, 2026-02. Pages relied on: not yet read in detail. Source: link
[47] A122 Lower Thames Crossing (TR010032) Deadline 6 written representations on behalf of E and K Benton Limited (AP1717)
Holland Land & Property Ltd, 31 October 2023 (PINS ref TR010032-004758). Planning Inspectorate / Holland Land & Property Ltd, 2023-10-31. Pages relied on: 1-2 (ownership 204.22 ha at South Ockendon; EA Strategic Land promotion since 2018; Horndon on the Hill holding). Source: link SHA-256: b06e66a11c41bf7b5c88e4a50c78229cbc8ce07fa95e292d5862737ddb280acb.
[48] Thurrock Local Plan Initial Proposals Document, December 2023 (Regulation 18)
Thurrock Council, 2023-12. Pages relied on: Section 5 spatial options; Section 7 New Place Opportunity Areas, Lower Langdon p147. Source: link
[49] Thurrock Local Plan Initial Proposals Boroughwide Map, 2023
Thurrock Council, 2023-12. Pages relied on: map. Source: link
[50] Thurrock Local Plan Initial Proposals Integrated Impact Assessment, November 2023 (LUC)
Thurrock Council, 2023-11. Pages relied on: Ch 2 spatial options (Option 5 WH 7,000 + North Stanford 4,000); new place Lower Langdon 4,000-5,000. Source: link
[51] Local Plan Regulation 19 Guidance, September 2026
Thurrock Council, 2026-09. Pages relied on: how to make a representation. Source: link
[52] Thurrock Local Plan Regulation 19 Representation Form
Thurrock Council, 2026-09. Pages relied on: form. Source: link
[53] Statement of Community Involvement, November 2023
Thurrock Council, 2023-11. Pages relied on: plan-making consultation commitments. Source: link
[54] Thurrock Local Plan Initial Proposals IIA Appendices, November 2023
Thurrock Council, 2023-11. Pages relied on: option and site appraisal matrices. Source: link
[55] Habitat Regulations Assessment: scoping and discussion, January 2019
Thurrock Council, 2019-01. Pages relied on: SSSI and SPA scope. Source: link
[56] Integrated Sustainability Appraisal, Issues and Options Stage 2, December 2018
Thurrock Council, 2018-12. Pages relied on: spatial options. Source: link
[57] Integrated Sustainability Appraisal appendices, December 2018
Thurrock Council, 2018-12. Pages relied on: appraisal matrices. Source: link
[58] Thurrock Local Plan Issues and Options (Stage 2), December 2018
Thurrock Council, 2018-12. Pages relied on: spatial options, Langdon area. Source: link
[59] Issues and Options (Stage 2) Report of Consultation, 2019
Thurrock Council, 2019. Pages relied on: responses. Source: link
[60] Thurrock Local Plan Issues and Options (Stage 1), 2016
Thurrock Council, 2016-02. Pages relied on: context. Source: link
[61] Corringham Stakeholder Charrettes 2022 (Prince's Foundation for Thurrock Council)
Thurrock Council, 2022. Source: link
[62] Horndon on the Hill Stakeholder Charrettes 2022 (Prince's Foundation)
Thurrock Council, 2022. Source: link
[63] Stanford-le-Hope Stakeholder Charrettes 2022 (Prince's Foundation)
Thurrock Council, 2022. Source: link
[64] Integrated Impact Assessment scoping report, June 2022, part 1
Thurrock Council, 2022-06. Pages relied on: baseline. Source: link
[65] Integrated Impact Assessment scoping report, June 2022, part 2
Thurrock Council, 2022-06. Pages relied on: baseline. Source: link
[66] Issues and Options (Stage 1) Report of Consultation, 2016
Thurrock Council, 2016. Pages relied on: responses. Source: link
[67] Guidelines for Ecological Impact Assessment in the UK and Ireland v1.3
CIEEM, 2024-09. Source: link
[68] Guidelines for Ecological Report Writing 2nd edition
CIEEM, 2017-12. Source: link
[69] Surveillance Camera Code of Practice
Home Office, 2021-11. Source: link
[70] WeBS Survey Methods Analysis and Interpretation
BTO RSPB JNCC and NatureScot. Source: link
[71] NECR207 Functional linkage: how areas functionally linked to European sites have been considered when they may be affected by plans and projects
Natural England, 2016-02-29. Source: link
[72] BTO Acoustic Pipeline User Manual
BTO. Source: link
[73] BTO Research Report 785 Acoustic Pipeline applied and manually verified at landscape scale
BTO, 2025-04-28. Source: link
[74] National Planning Policy Framework, December 2024 (as amended 7 February 2025)
Ministry of Housing, Communities and Local Government. The Framework against which the plan is examined (item 75, Annex A paragraph 8). Archived at link
[75] National Planning Policy Framework, August 2026 (published 17 August 2026)
MHCLG. Annex A (transitional arrangements); national decision-making policies N1, N6, GB2 to GB8; Annex B; Annex E. link
[76] Planning Practice Guidance: Green Belt (February 2025); Housing supply and delivery; Housing and economic needs assessment
MHCLG. link
[77] Procedure Guide for Local Plan Examinations (legacy system), 11th edition, 20 July 2026
Planning Inspectorate. link
[78] Letters from the Minister for Housing and Planning to the Chief Executive of the Planning Inspectorate, 30 July 2024, 8 October 2025, 27 November 2025 and 15 July 2026
Note at evidence/press/pennycook-pins-letters-2024-2026-NOTE.md.
[79] Written Ministerial Statement, 27 November 2025, on the duty to cooperate; Town and Country Planning (Local Planning) (England) Regulations 2026 (in force 25 March 2026)
Note at evidence/press/duty-to-cooperate-abolished-2026-03-25-NOTE.md.
[80] Planning and Compulsory Purchase Act 2004, sections 19, 20, 33A (repealed in effect), 39
[81] Town and Country Planning (Local Planning) (England) Regulations 2012, regulations 18 to 22
[82] Environmental Assessment of Plans and Programmes Regulations 2004, regulations 12 and 13 and Schedule 2
[83] Conservation of Habitats and Species Regulations 2017, regulation 105
[84] Wildlife and Countryside Act 1981, sections 28G and 28I, Schedules 1, 5 and 8
[85] Natural Environment and Rural Communities Act 2006, sections 40 and 41, as amended by the Environment Act 2021 section 102
[86] Protection of Badgers Act 1992
[87] Natural England, SSSI Impact Risk Zones: User Guidance, version 5.4, 2 April 2025
Supplied by Natural England, 17 September 2026. evidence/pdf/ne-sssi-irz-user-guidance-v5.4-2025-04-02.pdf; evidence/text/ne-sssi-irz-user-guidance-v5.4.txt.
[88] Natural England, Designated Sites View: Langdon Ridge SSSI, site code S2000857 (site details, site pressures, unit condition), retrieved 1 September 2026
[89] Natural England, Consultations Hub, letter to Dr J Lighten, 17 September 2026, reference 558703
correspondence/2026-09-17-Natural-England-Consultations-Hub-reply-RECEIVED.md.
[90] Natural England, Ancient Woodland Inventory (England), and SSSI unit boundaries, open data, retrieved 1 and 5 September 2026
gis/layers/.
[91] Environment Agency open data: Flood Map for Planning, Flood Zones 2 and 3 (May 2026)
Flood Zones plus Climate Change (25 March 2025); Statutory Main River Map; Source Protection Zones; Recorded Flood Outlines. Queried 10 September 2026 against the traced allocation boundary. gis/ea-open-data/.
[92] Thurrock Council, Cabinet report 26 August 2026, paragraphs 4.18, 4.19, 4.25, 4.27, 4.30 to 4.32, 5.2, Table 4 (see item 4)
[93] Thurrock Council, Facebook statement 'Langdon Hills Clarification', 18 September 2026, attributed to Cllr Richard Bingley
requests/EIR-Thurrock-SUPPLEMENTARY-2026-09-19-disposal-and-promoter-SENT.md.
[94] Thurrock Council, Regulation 19 consultation page and drop-in schedule, read 8 September 2026
evidence/press/thurrock-reg19-dropin-schedule-2026-09.md.
[95] Ministry of Housing, Communities and Local Government, direction to Basildon Borough Council under section 27 of the Planning and Compulsory Purchase Act 2004
21 July 2026.
[96] Basildon Echo, 'Basildon Council in weak position after rejected plans', 26 August 2026
evidence/press/echo-2026-08-26-basildon-weak-position.txt.
[97] Royal Society of Arts, press release, 'Thames Freeport trials new approach to making investment work for local communities'
12 May 2026 ("created 1,600 jobs across East London and South Essex"), link evidence/press/rsa-2026-05-12-thames-freeport-social-value-NOTE.md; Your Thurrock, 'Thames Freeport Growth Plan to deliver up to 12,000 jobs for local people', 14 September 2026 (up to 28,000 jobs over 20 years, up to 12,000 for local residents, across Thurrock, Barking and Dagenham, and Havering), evidence/press/yourthurrock-2026-09-14-thames-freeport-growth-plan-NOTE.md.
[98] Heard v Broadland District Council [2012] EWHC 344 (Admin)
[99] Save Historic Newmarket Ltd v Forest Heath District Council [2011] EWHC 606 (Admin)
[100] Cogent Land LLP v Rochford District Council [2012] EWHC 2542 (Admin)
[101] Calverton Parish Council v Nottingham City Council [2015] EWHC 1078 (Admin)
[102] Compton Parish Council v Guildford Borough Council [2019] EWHC 3242 (Admin)
[103] Gladman Developments Ltd v Secretary of State for Housing, Communities and Local Government [2021] EWCA Civ 104
[104] People Over Wind and Sweetman v Coillte Teoranta, Case C-323/17, CJEU, 12 April 2018
[105] Holohan v An Bord Pleanala, Case C-461/17, CJEU, 7 November 2018
[106] Wealden District Council v Secretary of State for Communities and Local Government [2017] EWHC 351 (Admin)
[107] R (Moseley) v Haringey London Borough Council [2014] UKSC 56
[108] Woods M., McDonald R.A. and Harris S., 'Predation of wildlife by domestic cats Felis catus in Great Britain', Mammal Review 33: 174 to 188, 2003
[109] Examination records: Greater Norwich, North Essex, Uttlesford and Wealden Local Plans
Greater Norwich Local Plan, Inspectors' Report (Mike Worden and Thomas Hatfield, February 2024), paragraphs 85 to 87 and main modification MM18, link North Essex Authorities Shared Strategic Section 1 Plan, Inspector's letter IED011 (Roger Clews, 8 June 2018) and Inspector's Report (10 December 2020); Uttlesford Local Plan, Inspectors' letter ED82 (10 January 2020) [131]; Wealden Local Plan, Inspector's letter (Louise Nurser, December 2019) and the Council's withdrawal of the plan on 19 February 2020.
[110] Office for National Statistics, Business Register and Employment Survey (open access)
Nomis dataset NM_189_1, Thurrock (E06000034), employment by SIC 2007 division, 2015 to 2024; retrieved 23 September 2026. evidence/data/bres-thurrock-2015-2024-employment.json; analysis at report/BRES-JOBS-RECORD-NOTE-2026-09-23.md.
[111] DP World, news release, 'New 10-year Local Development Order backs growth of London Gateway Logistics Park', 12 March 2025
link Retrieved 23 September 2026; data and calculations at evidence/data/london-gateway-density-2026-09-23.json; analysis at report/LONDON-GATEWAY-DENSITY-NOTE-2026-09-23.md.
[112] Ministry of Housing, Communities and Local Government, Live Table 122
"Housing supply; net additional dwellings, by local authority district, England", 2001-02 to 2024-25, published 20 November 2025. link (SHA-256 35667e8610b92d818257433b7b625e37c59da25aea8338e3c30361b580b68e38). Analysis: report/HOUSEBUILDING-RECORD-NATIONAL-COMPARISON-NOTE-2026-09-23.md; data evidence/data/housebuilding-record-lt122-lt125-2026-09-23.json.
[113] Care Quality Commission, "CQC drops rating of Basildon University Hospital to inadequate", press release, 15 October 2025
link With Your Thurrock, 15 October 2025. Analysis: report/HEALTH-CHECK-NOTE-2026-09-23.md.
[114] Environment Agency, public register of water discharge permits for Tilbury Water Recycling Centre
Permits CNTW.0531/001 to /008 and CNTW.0532/001, and Consented Discharges to Controlled Waters with Conditions (dataset 5fe5ab2e-d465-11e4-8a42-f0def148f590), retrieved 23 September 2026. Data: evidence/data/tilbury-wrc-permit-and-edm-2026-09-23.json.
[115] Environment Agency, Event Duration Monitoring, Storm Overflows
Annual Returns 2021 to 2025, Anglian Water sheet, and the 2025 dataset guide (26 March 2026) (dataset 21e15f12-0df8-4bfc-b763-45226c16a8ac). Analysis: report/TILBURY-PERMIT-AND-OVERFLOWS-NOTE-2026-09-23.md.
[116] Essex & Suffolk Water, Water Resources Management Plan 2024, final, 15 October 2024 (273 pages)
link Pages relied on: PDF 7, 28, 29, 36, 81, 89 to 94, 124, 128, 174, 175, 202. Extracts: evidence/text/esw-wrmp24-final-and-statement-of-response-EXTRACTS.md.
[117] Essex & Suffolk Water, Draft WRMP24 Consultation Statement of Response, 11 September 2023, refs 69 to 74 (Thurrock Council) and 226 to 231 (Basildon Council)
[118] Ministry of Housing, Communities and Local Government, Live Table 125, "Dwelling stock estimates by local authority district", 2001 to 2025 (unrounded)
link (SHA-256 8bf5ca0244e68d8cf8096e200535035fb02fada1802717327f933015c50c41b2).
[119] NHS England Digital, Hospital Accident and Emergency Activity 2024-25
[120] Thurrock Council, Brownfield Land Register, last updated 1 April 2024
Summary: evidence/data/brownfield-register-2024-summary.md; analysis report/BROWNFIELD-AND-ALTERNATIVES-NOTE-2026-09-23.md.
[121] Natural England, Provisional Agricultural Land Classification (England) and Agricultural Land Classification Post 1988, queried 23 September 2026
Analysis: gis/ea-open-data/alc-check-2026-09-23.md.
[122] Thurrock Council online planning register, applications at the eight addresses in and around the SS18 allocation
Old Hill Avenue, South Avenue, Vange Park Road, One Tree Hill, Park Road, Hovels Farm, Arden Hall and North Hill, 1948 to 2026, harvested 3 September 2026. Data: evidence/planning-history/; analysis report/PLANNING-HISTORY-NOTE-2026-09-23.md; map gis/maps/refusals-map.png.
[123] HM Treasury, Autumn Statement, 22 November 2023: Freeport tax reliefs in England extended to 30 September 2031
The extension is conditional on agreed delivery plans. GOV.UK Freeports tax reliefs guidance. Timeline: report/TIMELINE-NOTE-2026-09-23.md.
[124] Independent analyses made for this representation, 23 September 2026, each with method, data and limits: report/INDEPENDENT-ANALYSES-REGISTER-2026-09-23.md (index)
report/SITE-SELECTION-RESCORE-NOTE-2026-09-23.md; report/CAPACITY-RECHECK-NOTE-2026-09-23.md; report/INFRASTRUCTURE-COST-CHECK-NOTE-2026-09-23.md; report/NEIGHBOURS-NEED-NOTE-2026-09-23.md; report/WATER-AND-SEWERAGE-NOTE-2026-09-23.md; report/TIMELINE-NOTE-2026-09-23.md; report/REPLACEMENT-SUPPLY-NOTE-2026-09-23.md with tools/hlaa_replacement_supply.py and evidence/data/hlaa-appendix4-sites-2026-09-23.csv.
[125] Thurrock Housing Land Availability Assessment, Appendix 1, Methodology, October 2025
Thurrock Council; posted to the evidence page in September 2026. Pages relied on: 8 to 13 (Tables 1 to 4, paragraphs 2.17, 2.23, 2.24, 2.29). Source: link
[126] Planning Practice Guidance, Housing and economic land availability assessment, Paragraphs 002, 004, 008, 018 and 026 (Reference IDs 3-002-20190722 to 3-026-20190722)
MHCLG. link
[127] Epsom and Ewell Borough Council, Draft Local Plan 2022 to 2040, Site Assessment Methodology, consideration 4 (SSSI and SAC) and section 3.4
[128] Cheshire East Council, Site Allocations and Development Policies Document, Site Selection Methodology Report [ED 07], August 2020, paragraphs 2.14 to 2.20
[129] Mott MacDonald for Anglian Water, Cambridge Waste Water Treatment Plant Relocation, SSSI Impact Risk Zone Addendum (December 2020)
Stage 4 Final Site Selection, Appendix L of that report, sections 1.1 and 5.1 (recording Natural England's advice of 28 August 2020).
[130] Thames Basin Heaths SPA Delivery Framework, Thames Basin Heaths Joint Strategic Partnership Board (Natural England advising), 12 February 2009
Paragraphs 4.2, 4.3, 4.5 and 5.9, footnote 6.
[131] Uttlesford Local Plan Examination, Inspectors' letter to the Council following the Stage 1 hearings (ED82), 10 January 2020
[132] Independent analyses made for this representation, 25 September 2026, each with method, data and limits: report/BALANCE-SCORE-NOTE-2026-09-25.md
report/SITE-SELECTION-METHOD-APPRAISAL-2026-09-25.md; report/FILE-NOTE-2026-09-25-ARUP-FIG-3-1-SSSI.md; evidence/data/hlaa-balance-scores-2026-09-25.csv with tools/hlaa_balance_scores.py; evidence/data/sssi-proximity-2026-09-24.json (maximum distances added 25 September); gis/maps/sssi-drawn-in-full-vs-arup-fig3-1-2026-09-25.png.
[133] Viability rebuild made for this representation, 1 October 2026: report/VIABILITY-REBUILD-NOTE-2026-10-01.md
with tools/viability_model.py, tools/viability_ss18_combined.py and evidence/data/viability-ss18-combined-2026-10-01.json. Source pages: Viability Assessment [29], appendix appraisals for site 60940 (PDF pages 1142 to 1148) and site 60893 (PDF pages 1205 to 1211), text in evidence/text/viability-appendix-60940/ and evidence/text/viability-appendix-60893/.
[134] Defra Strategic Noise Mapping, Round 4 (England), road noise
all roads: LAeq,16h, Lden and Lnight, 10 metre grid at 4 metres, 2021 traffic; Defra Data Services Platform dataset 562c9d56-7c2d-4d42-83bb-578d6e97a517, retrieved 4 October 2026. Extraction and barrier line-of-sight check made for this representation, 4 October 2026: report/NOISE-A13-DEFRA-ROUND4-NOTE-2026-10-04.md, tools/noise_defra_round4_extract.js, tools/noise_barrier_line_of_sight.py, gis/model-outputs/noise-barrier-los/summary.json. Thresholds: WHO Environmental Noise Guidelines for the European Region (2018); BS 8233:2014; ProPG: Planning and Noise, Professional Practice Guidance on Planning and Noise for New Residential Development (Institute of Acoustics, Association of Noise Consultants and Chartered Institute of Environmental Health, May 2017), Figure 1. Barrier examples and costs: Maccaferri, M40 noise bund for Bellway Homes, Banbury (2016), link Contracts Finder, National Highways A47 Blofield to North Burlingham acoustic barriers (published 21 June 2022), link Land budget and viability with the bund: tools/stepdown_2026_10_01.py and tools/viability_ss18_combined.py (evidence/data/ss18-stepdown-2026-10-01.json, viability-ss18-combined-2026-10-01.json).
[135] Thurrock Council planning register (regs.thurrock.gov.uk), read 4 October 2026
Stanford Road estate, 17/00403/FUL (127 homes, Persimmon): Noise Assessment, Grant Acoustics, GA-2015-0051-R1-RevA, 16 March 2016, Tables 4.1, 5.1 and 5.2 and page 13; Environmental Health comment, 12 April 2017; Planning Committee 18 October 2018, item 53, officer report paragraphs 6.35 to 6.40 and minutes (democracy.thurrock.gov.uk/mgAi.aspx?ID=8696); Decision Notice, 10 October 2019, condition 24. Manorway estate, 14/01321/OUT, 20/00453/CV and 18/01660/REM (153 homes): outline Decision Notice, 16 December 2015, condition 39; Environmental Health comment, December 2014; Noise Assessment Addendum, Sharps Acoustics, March 2014; Environmental Noise Assessment, Sharps Gayler, 15 October 2018, paragraphs 4.11 to 4.13, 4.23 and 5.1 to 5.2; Environmental Health comment, 26 July 2019; Committee Report, 13 August 2020, paragraph 6.42; Boundary and Dwelling Materials Layout, 8 July 2019. Defra Round 4 levels over the two estates (OpenStreetMap residential areas, ways 103829176 and 661612062): report/NOISE-A13-DEFRA-ROUND4-NOTE-2026-10-04.md, section 5; gis/layers/comparator-estates-stanford-2026-10-04.geojson.
[136] Historic England, reply to Environmental Information Regulations request
reference 26/04253, 5 October 2026 (Mark Wilkins, Access to Information Officer), with Historic England to Thurrock Council, "Local Plan - Initial Proposals Document, Regulation 18, December 2023 and Integrated Impact Assessment, November 2023", 16 February 2024, ref. PL00794922 (redacted). correspondence/2026-10-05-Historic-England-EIR-26-04253-reply-RECEIVED.md; evidence/correspondence/2026-10-05-Historic-England-EIR-26-04253-Reg18-response-2024-02-16-redacted.pdf (manifest id he-reg18-response-2024-02); follow-up sent 5 October 2026, correspondence/2026-10-05-Historic-England-HIA-finding-follow-up-SENT.md.
[137] Natural England, response to Environmental Information Regulations request EIR2026/11807, 5 October 2026 (Access to Information Team, Legal and Governance), items 1 to 9
correspondence/2026-10-05-Natural-England-EIR2026-11807-response-RECEIVED.md; evidence/correspondence/2026-10-05-Natural-England-EIR2026-11807-response.pdf (manifest id ne-eir2026-11807-response).
[138] Natural England, documents released with its response to EIR2026/11807
5 October 2026 (received by Quatrix): Regulation 18 response to Thurrock Council, 19 February 2024 (refs 461196 and 461201); response on the Thurrock Transport Strategy SEA and HRA, 3 July 2026 (refs 550038 and 550033); planning advice on 24/01051/OUT West Horndon (6 November 2024), 24/01248/OUT Vange (9 December 2024; 1 September 2025; 11 February 2026, with internal emails of 26 and 27 November 2024), 25/00541/OUT Mandeville Way (27 May 2025; 3 December 2025; 16 March 2026), 24/00729/FULL Lower Dunton Road (16 July 2024), 25/00571/OUT Lampits Hill, Corringham (25 June 2025) and 25/01060/OUT Corringham (1 October 2025); Discretionary Advice Service letters on West Horndon (3 June and 16 July 2024) and Vange (9 April 2025); the list of relevant planning cases; and the Langdon Ridge SSSI notification file (notification document, confirmed citation, views about management, operations requiring consent, supporting information, maps) and condition summary (generated 11 September 2026). evidence/correspondence/ (folders as received); report/NE-EIR-ZIP-DEEP-DIVE-2026-10-05.md.
[139] Cole, R. L. (2011), 'Lawton and Langdon: the importance of the scheduled wildlife sites of the Langdon Living Landscape'
Basildon Natural History Society; section 13, Old Hill/Great Sutton Wood Local Wildlife Site (Th57). Supplied by the author. evidence/third-party/cole-2011-lawton-and-langdon.doc; text evidence/text/cole-2011-lawton-and-langdon.txt.
[140] East Devon District Council, report to Cabinet, 3 December 2025
'In Perpetuity Funding for Management of Clyst Meadows SANG' (published as Appendix A to Scrutiny Committee, 8 January 2026), link pages 1, 3 to 5; and Cabinet minutes, 3 December 2025, minute 118, link Extracts: evidence/text/east-devon-clyst-meadows-sang-costs-2025-12.txt. SANG model: tools/stepdown_2026_10_01.py; evidence/data/ss18-stepdown-2026-10-01.json; gis/model-outputs/sang-indicative-2026-10-05.geojson.
[141] Department for Environment, Food and Rural Affairs, 'National standards for sustainable drainage systems (SuDS)'
published 19 June 2025, updated 30 July 2025, Standard 3, link Essex County Council, 'Sustainable Drainage Systems Design Guide', February 2020, pages 16 to 17, 20, 25 to 27, 37 to 38 and 46, link Environment Agency peak rainfall allowances as tabulated in Basildon Borough Council, Level 1 Strategic Flood Risk Assessment, August 2024, Table 3 (PDF page 9). Extracts: evidence/text/suds-standards-extracts-2026-10-06.txt. Analysis: tools/suds_national_standard_2026_10_06.py; evidence/data/suds-national-standard-2026-10-06.json.
[142] Rural Payments Agency, Crop Map of England (CROME) 2021, 2022
2023 and 2024, Essex layers, Defra Data Services Platform web feature services (for example link), read 6 October 2026, and CROME_LUCODE_LOOKUP.XLSX; Department for Environment, Food and Rural Affairs, 'Provisional cereal and oilseed production estimates for England 2025' (9 October 2025, updated 20 January 2026), link and 'Agriculture in the United Kingdom 2022', chapter 7. Data: evidence/data/crome-lower-langdon-2021-2024.csv; evidence/data/farmland-lower-langdon-2026-10-06.json. Analysis: tools/fig_farmland_crome_2026_10_06.py; report/FARMLAND-FOOD-NOTE-2026-10-06.md.
[143] National Highways, reply #27759 to the letter and information request of 17 September 2026, with two released documents
National Highways, Spatial Planning South East, email of 8 October 2026 (Appendix E6), with (a) National Highways' Regulation 18 consultation response to Thurrock Council, 19 February 2024, 11 pages, and (b) an internal National Highways email of 16 January 2026, "RE: A13 (A130?) Trunking". Held in the evidence repository as evidence/correspondence/2026-10-08-National-Highways-27759-response.md and the two attachments.
[144] Woods, McDonald and Harris (2003), Predation of wildlife by domestic cats Felis catus in Great Britain
Woods, M., McDonald, R. A. and Harris, S. (2003). Predation of wildlife by domestic cats Felis catus in Great Britain. Mammal Review 33(2): 174 to 188. DOI 10.1046/j.1365-2907.2003.00017.x. Questionnaire survey of prey brought home by 986 cats in 618 households, April to August 1997 (14,370 prey items: mammals 69 per cent, birds 24 per cent, amphibians 4 per cent, reptiles 1 per cent), scaled to an estimate of about 92 million prey items, including 57 million mammals, for the British cat population over the survey period.
[145] De Frenne and Vangansbeke (2022), Nutrient fertilization by dogs in peri-urban ecosystems
De Frenne, P. and Vangansbeke, P. (2022). Nutrient fertilization by dogs in peri-urban ecosystems. Ecological Solutions and Evidence 3(1): e12128. Counts of dogs on 487 occasions over 18 months in four nature reserves around Ghent, Belgium, combined with published nutrient contents of dog urine and faeces: modelled inputs of about 11 kg of nitrogen and 5 kg of phosphorus per hectare per year across the reserves, concentrated along paths, with the authors concluding that these inputs favour nutrient-demanding species over rarer specialists and could delay restoration of nutrient-poor habitats.
[146] Thurrock Council, report to Cabinet, Next Tranche of Assets for Disposal, 18 March 2026, with Appendix 1 and Appendix 2
Report to Cabinet, 18 March 2026 (Kathryn Hurlock, Transformation Consultant for Property and Asset Management), recommendation 2.1 and paragraph 5.4: "Land at A13 Corringham and Land East of One Tree Hill" declared surplus as amenity land, woodland and open space; paragraph 4.3: all assets "reviewed with relevant service areas, including Regeneration, Planning, Housing, and Finance" and confirmed "non-operational with no identified current or future service requirement". Appendix 1, Schedule of Assets, item 4 (Corringham and Fobbing ward). Appendix 2, Asset Information, page 3: photographs and red-line location plan of the two parcels beside Hovels Farm, stated to be indicative only. democracy.thurrock.gov.uk, meeting MId 6759, documents s52120 (report, SHA-256 d1ef9a307385af4e344ea822177bdb999340e78aa41ff3d7420065324ac50f3f), s52121 (Appendix 1) and s52122 (Appendix 2, SHA-256 cd973244f4c132257bfd7e485cb666cb815877079055ebf463980f8e3b0cee42); retrieved 9 October 2026.
[147] CPRE, State of Brownfield 2026, and the Brownfield Land Register Regulations 2017
CPRE, the countryside charity, State of Brownfield report 2026 (published September 2026), compiled from Part 1 of every English planning authority's published brownfield register, 2025 reporting window: England 1.54 million minimum net dwellings, 859,722 with planning permission; 61 per cent of registers updated in 2025. Appendix, Table 2, Thurrock entry: register brownfield_register_2024.csv, 25 sites, 83.46 hectares, 3,755 minimum net dwellings, 3,481 with planning permission. https://www.cpre.org.uk/wp-content/uploads/2026/09/State-of-Brownfield-report-2026-web.pdf, retrieved 9 October 2026. Town and Country Planning (Brownfield Land Register) Regulations 2017 (SI 2017/403), regulation 17 (annual review of entries); Government guidance, Brownfield land registers, https://www.gov.uk/guidance/brownfield-land-registers. Register "last updated 1 April 2024" when retrieved from thurrock.gov.uk on 23 September 2026 (evidence/data/brownfield-register-2024-summary.md).
[148] Environment Agency, reply to Environmental Information Regulations request EIR2026/46894, 9 October 2026, with two released documents
Environment Agency, East Anglia Area Customers and Engagement team, letter of 9 October 2026 (8 pages) answering the request of 11 September 2026 on Policy SS18, with (a) the Agency's Regulation 18 response to the Thurrock Local Plan Initial Proposals, reference AE/2023/129077/01-L01, 6 February 2024, 32 pages, redacted for personal data (Lower Langdon at PDF page 23), and (b) flood risk assessment data (Product 4), customer reference GJ7EVH6M6EA4, created 6 October 2026, 33 pages (Stanford 2016 model by CH2M; modelled levels and flows at ten nodes, present day and climate change, no defences). Held in the evidence repository as evidence/correspondence/2026-10-09-Environment-Agency-EIR2026-46894-response.pdf, -attachment-a-Reg18-response-2024-02-06-redacted.pdf and -attachment-b-product-4-flood-risk-data-GJ7EVH6M6EA4.pdf (manifest ids ea-46894-reply, ea-46894-att-a, ea-46894-att-b); Products 5 to 7 (model report, outputs and model) offered by download link under the Agency's conditional licence.
[149] Anglian Water Services, reply to Environmental Information Regulations request, reference 2522, 12 October 2026
Anglian Water EIR team, email of 12 October 2026 answering the letter and request of 17 September 2026 on Policy SS18: consultation on the allocation, Tilbury Water Recycling Centre dry weather flow headroom, sewerage infrastructure and funding, and correspondence with the Council's Water Cycle Study consultants (summarised at Appendix E, item E8). Correspondence and shapefiles described but not supplied; follow-up sent 12 October 2026. Filed: evidence/correspondence/ (as received); correspondence/2026-10-12-Anglian-Water-EIR-2522-response-RECEIVED.md.
Appendix B. Maps: the allocation, the SSSI and its Impact Risk Zones, flood risk, the access lanes, the Green Belt sub-areas and the sewage route
Maps B1 and B5 are the Council's own, reproduced from its published documents. The others were made for this representation, drawn from the Council's site boundaries (HLAA polygons 60940 and 60893), Natural England's and the Environment Agency's open data, and OpenStreetMap, with the sources named in each caption. Maps already shown in the body or in the analysis appendices are listed with their figure numbers rather than repeated.
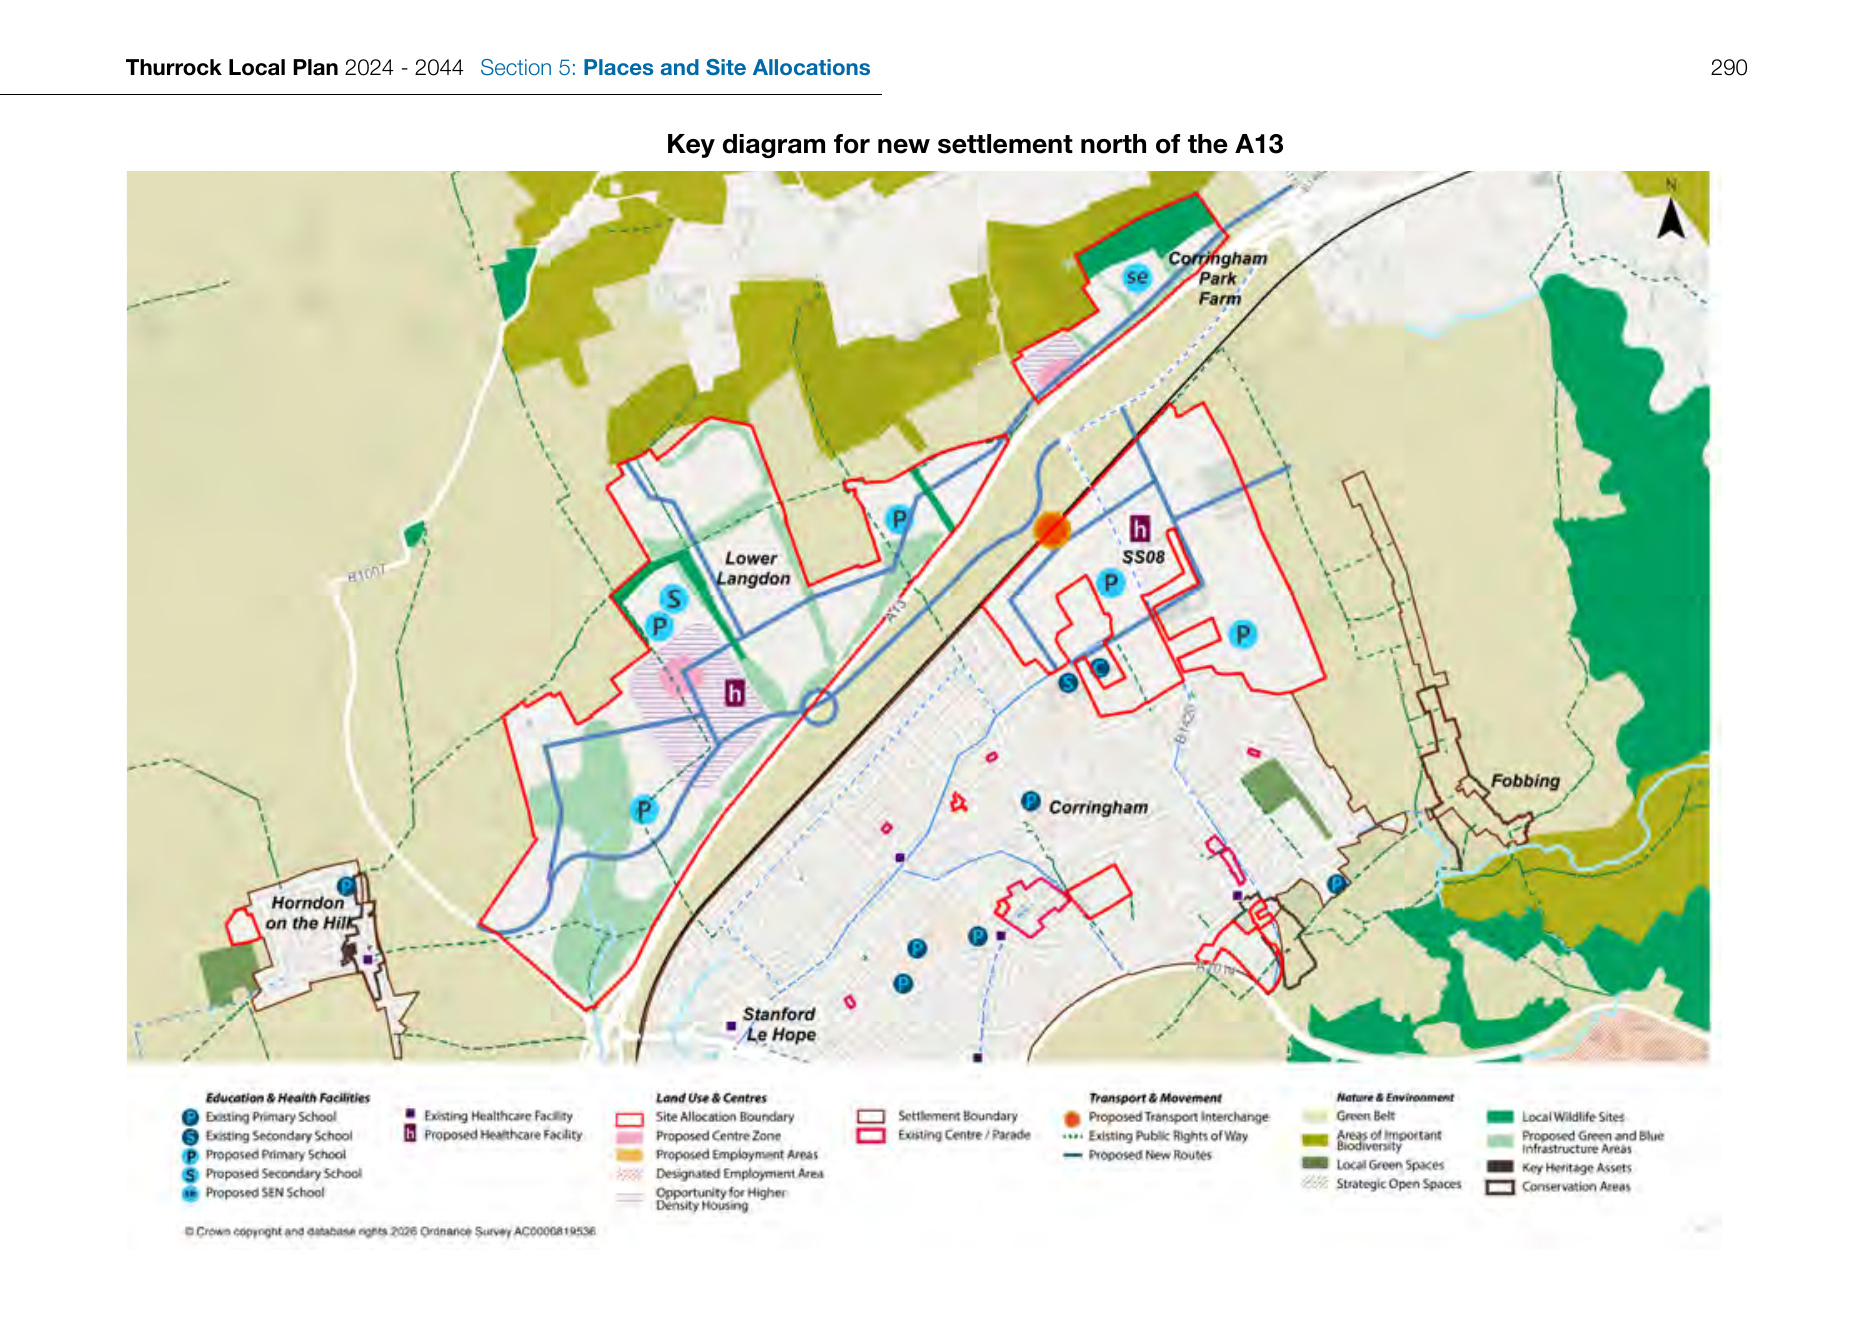
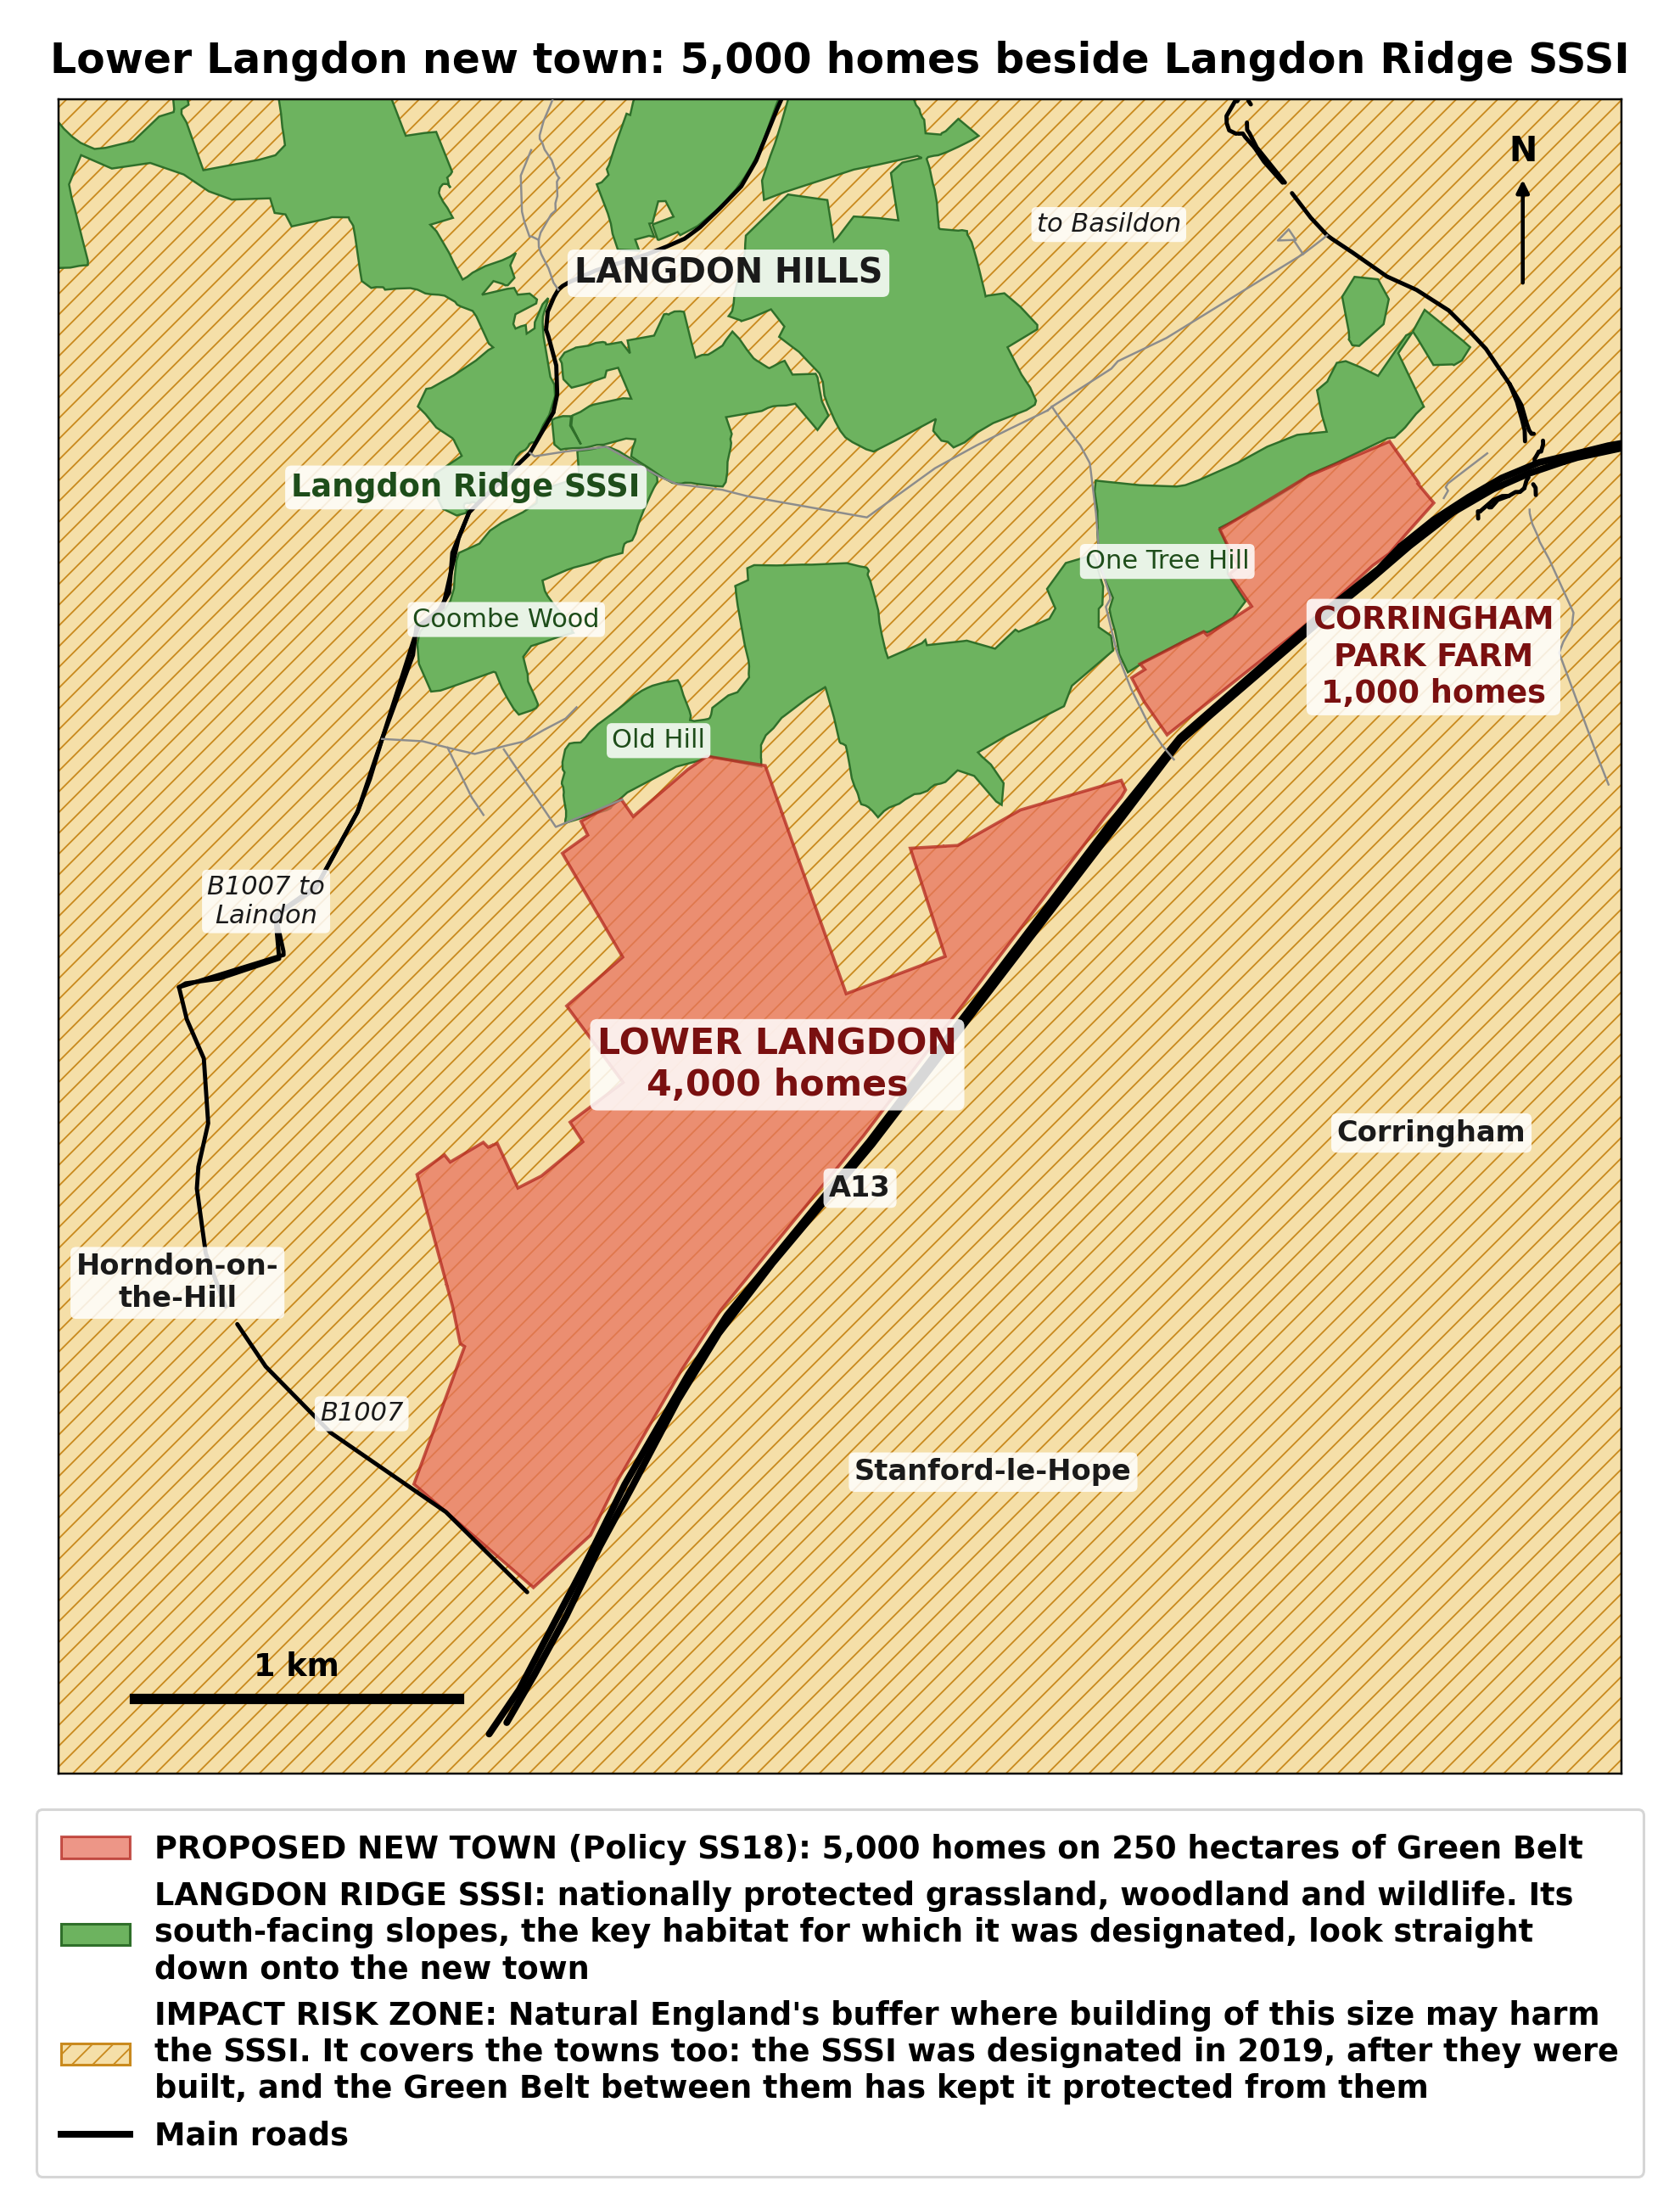
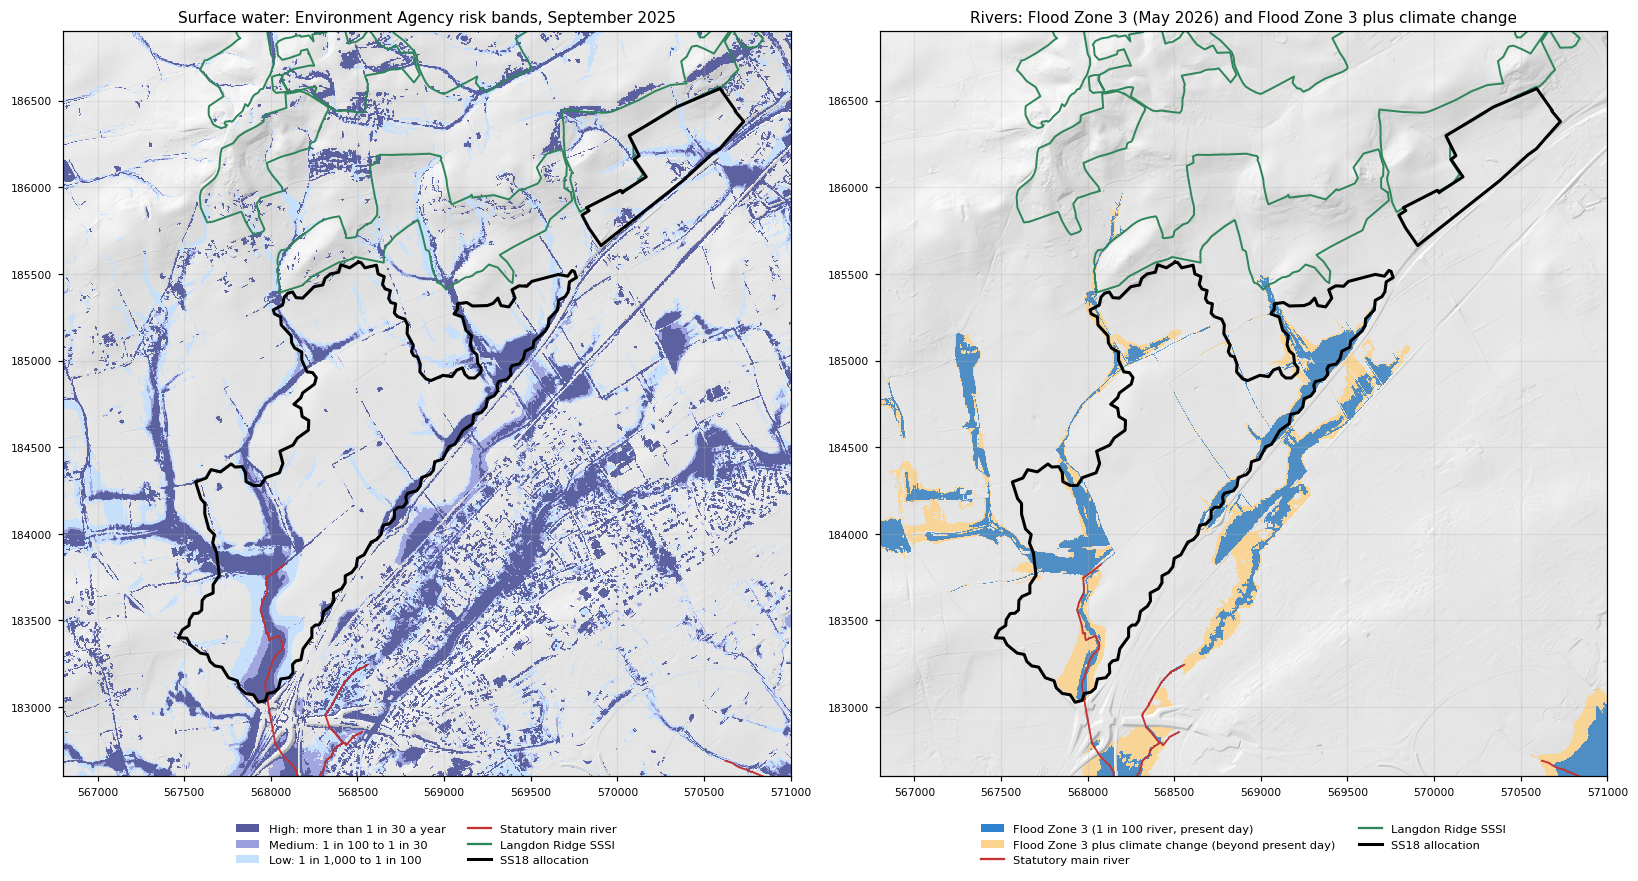
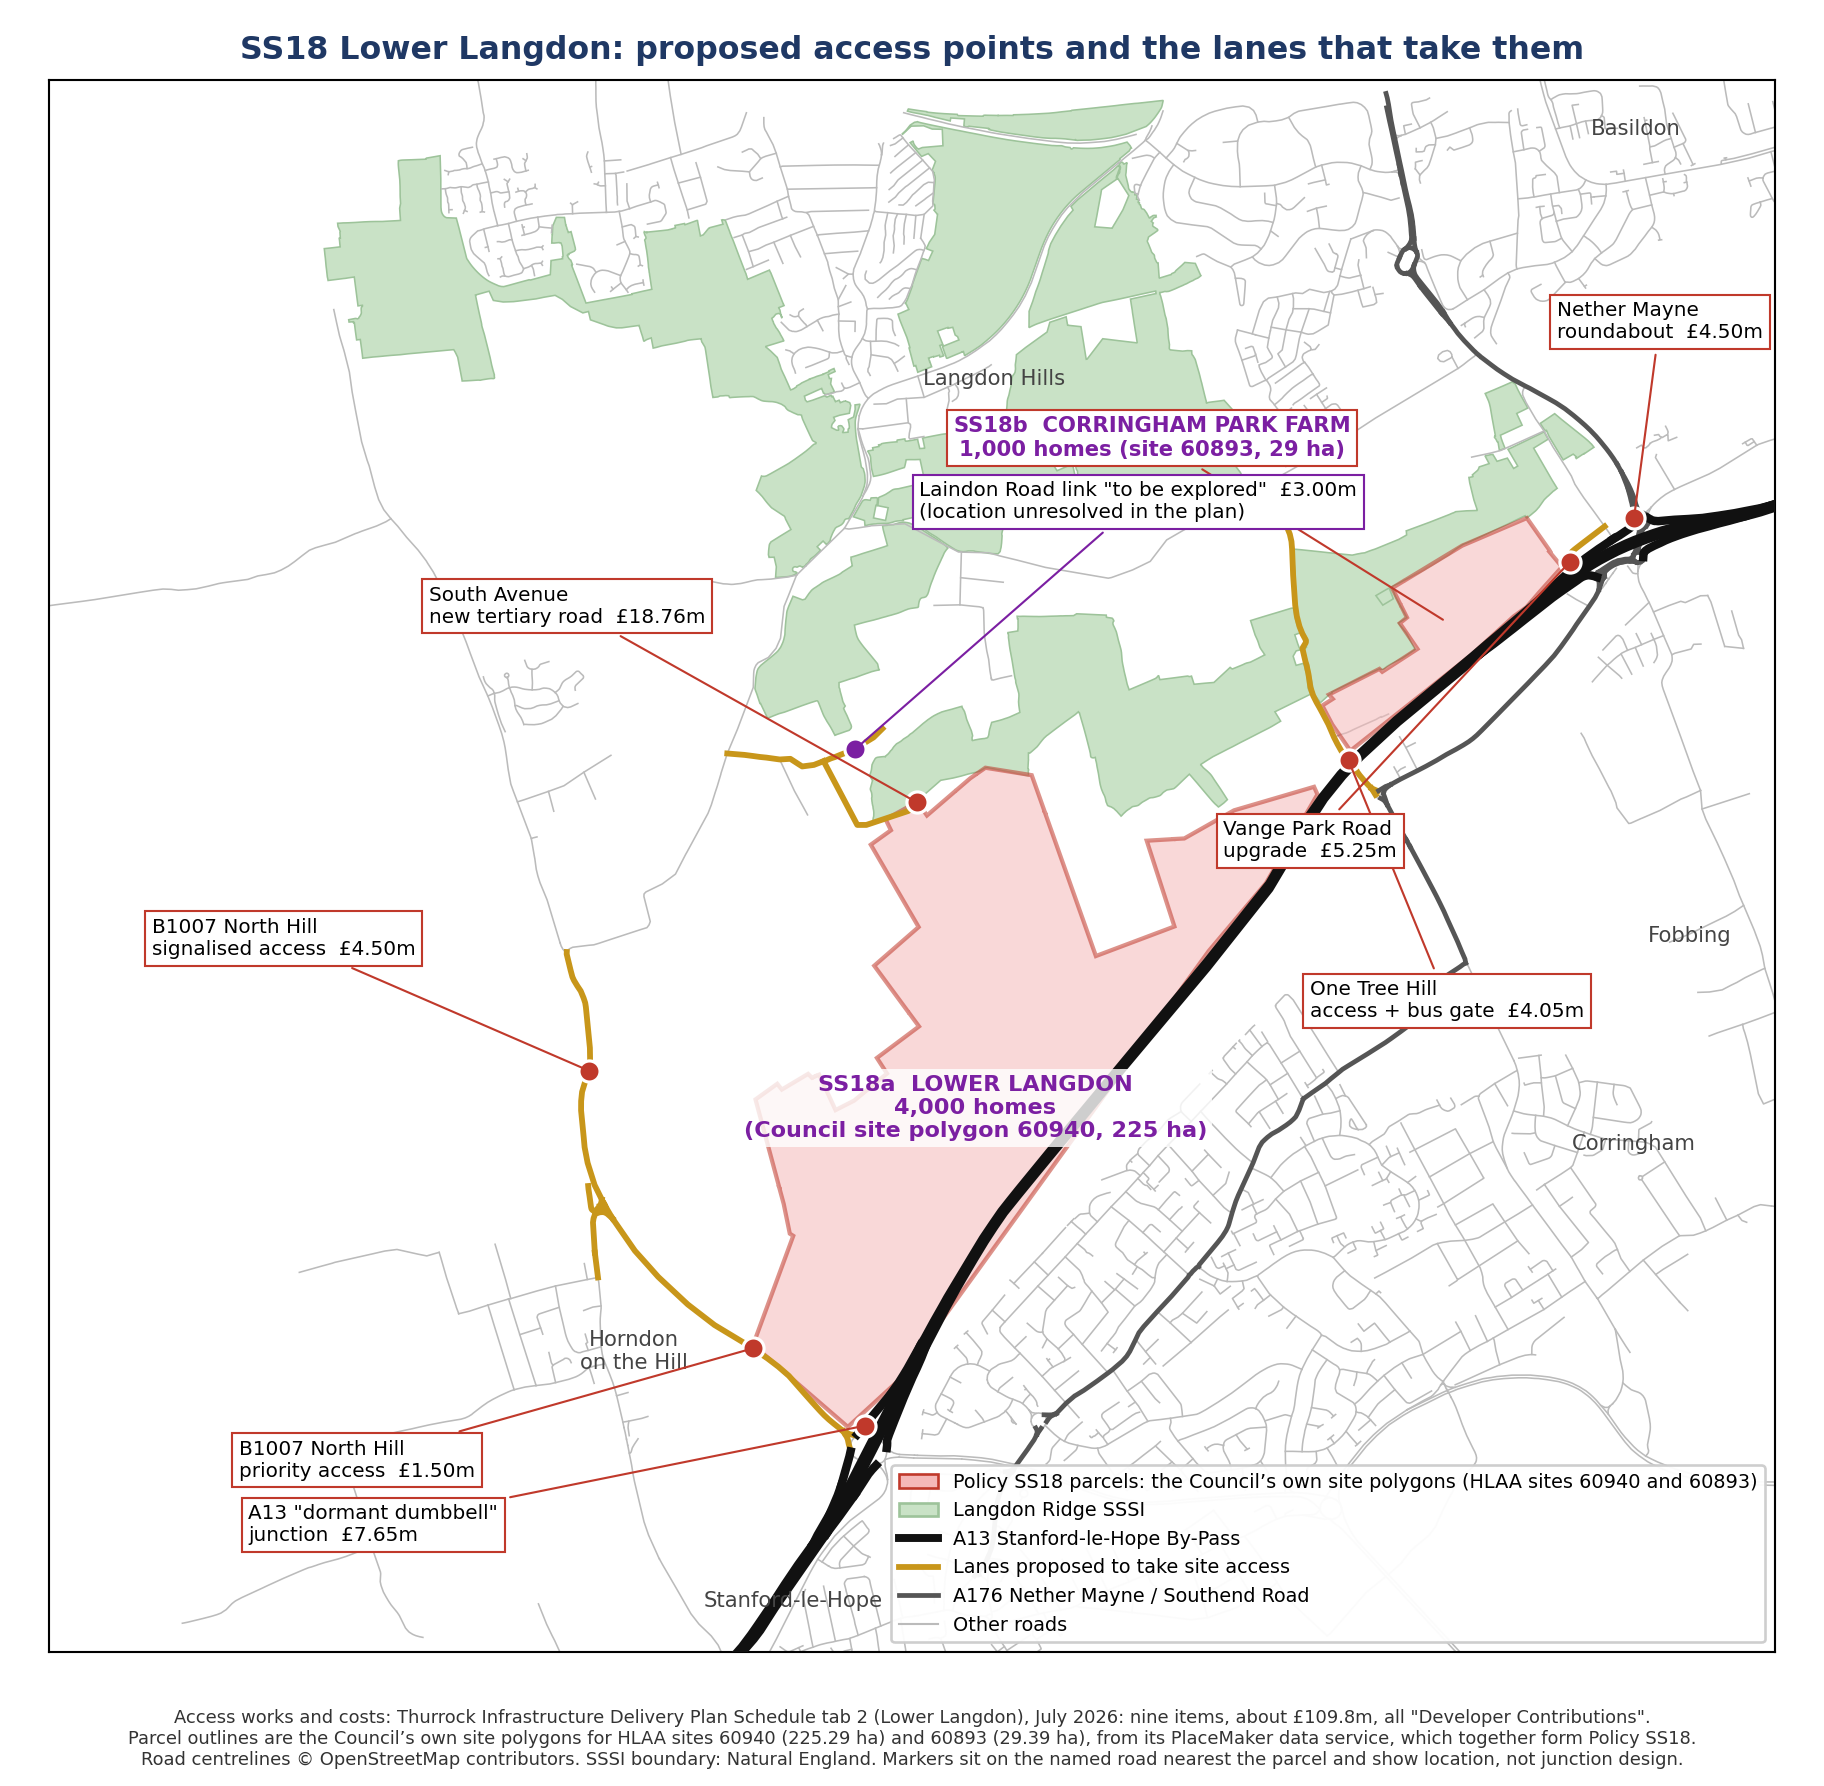
Photographs B1 to B18. South Avenue and Old Hill Avenue, the lanes the northern access would use. Photograph: Dr J. Lighten, 13 October 2026, taken walking from the northern edge of the allocation along South Avenue to Old Hill Avenue and the public footpath into Coombe Wood, in that order. The images are unedited except for resizing and the blurring of one vehicle number plate. One photograph that shows a neighbour's home has been left out. Full-resolution files: evidence/photos/2026-10-13-south-and-old-hill-avenue/.
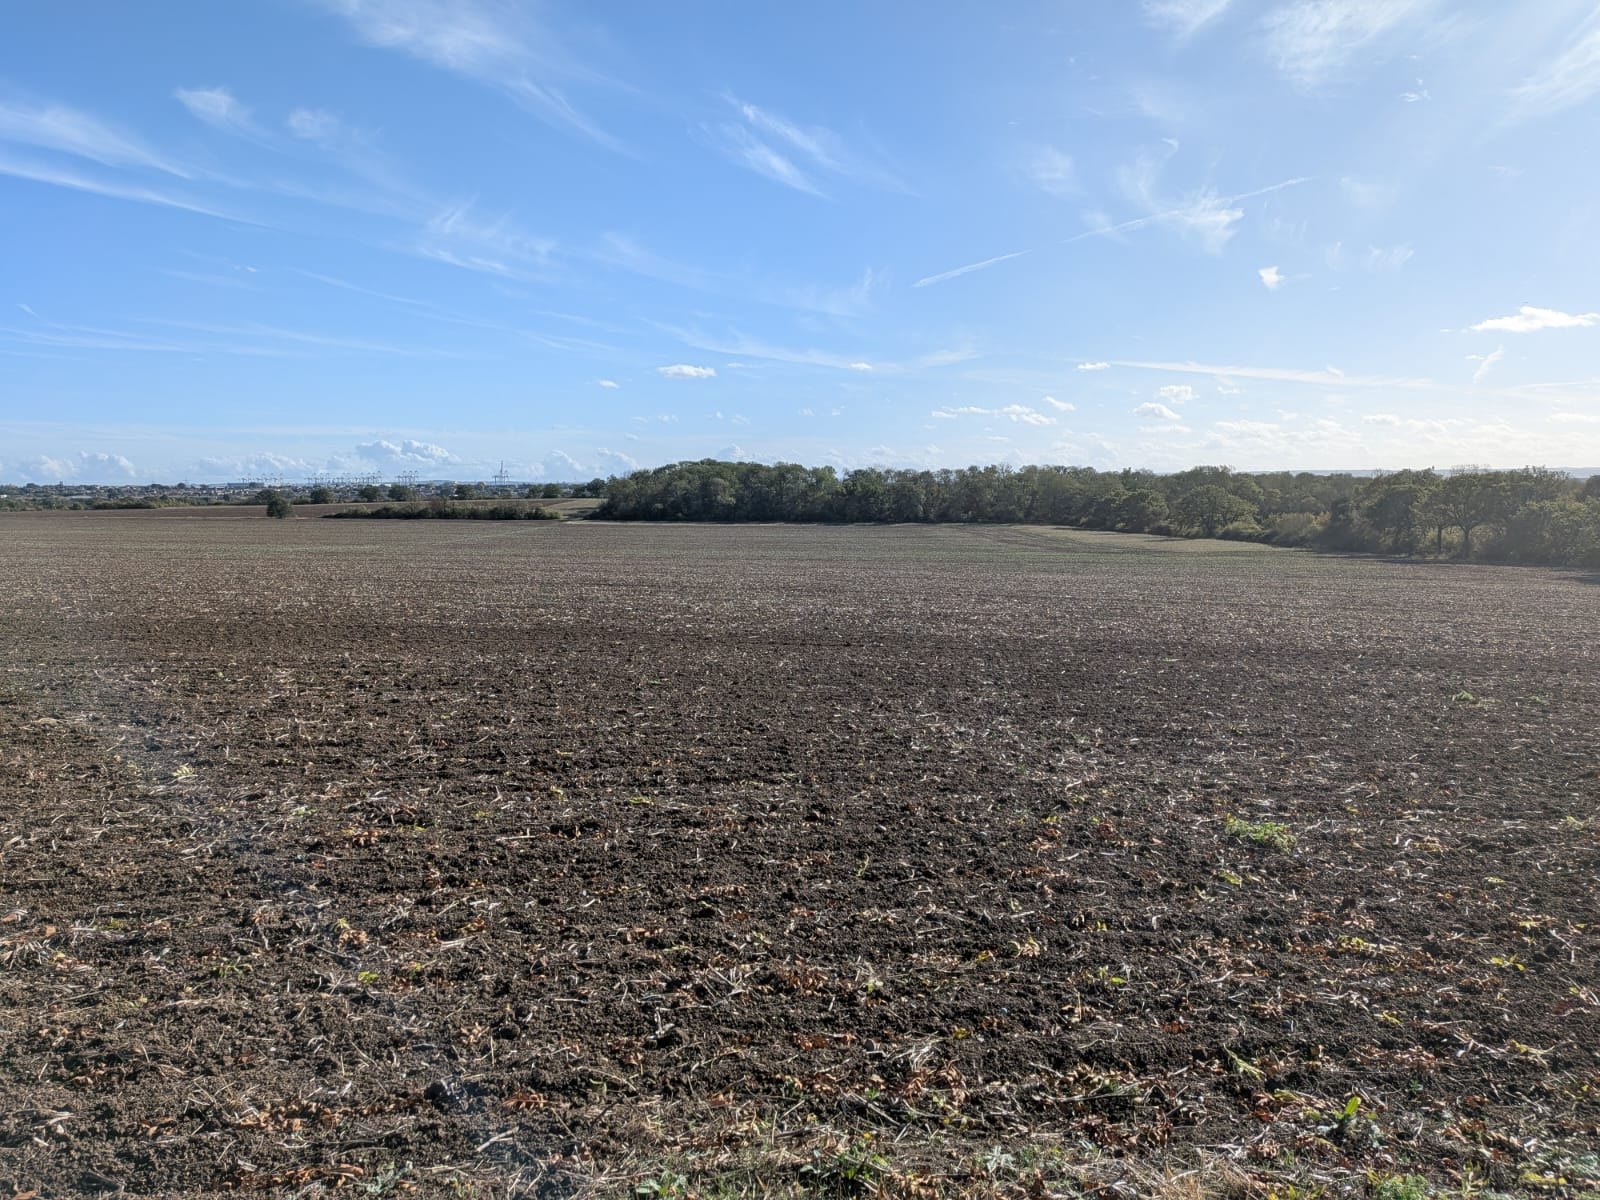
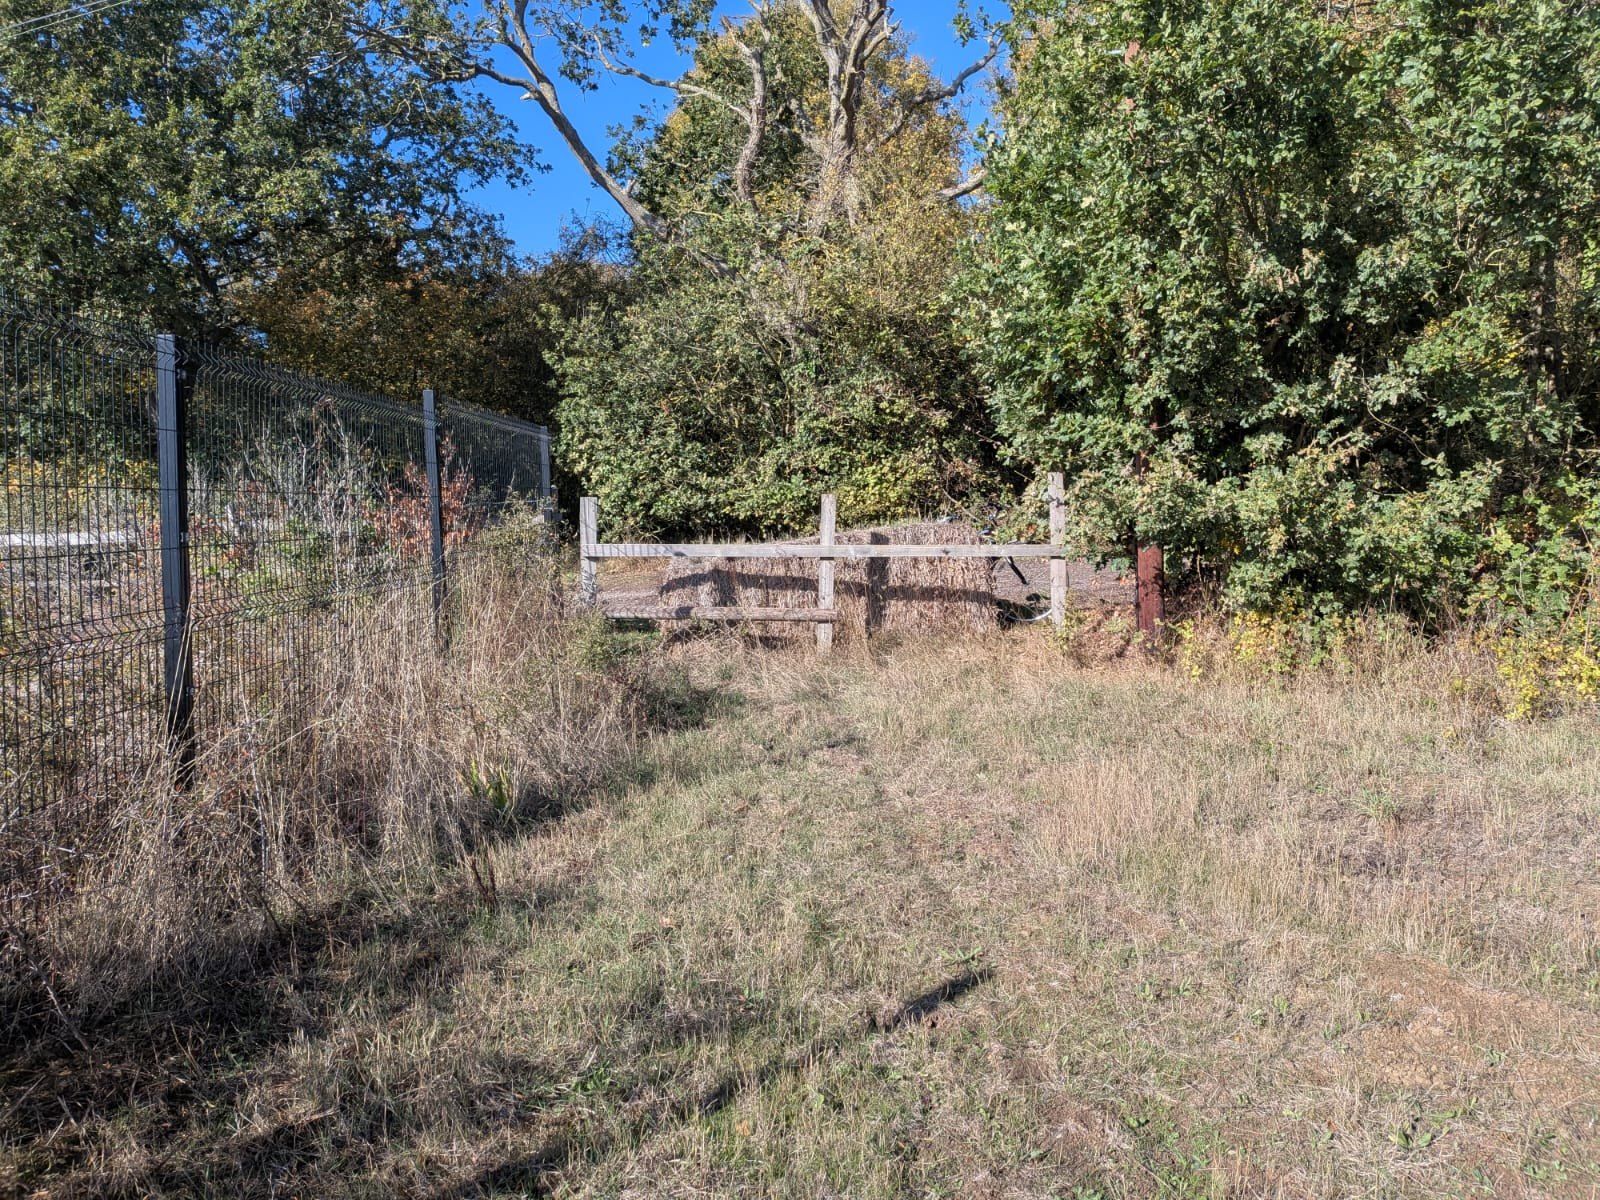
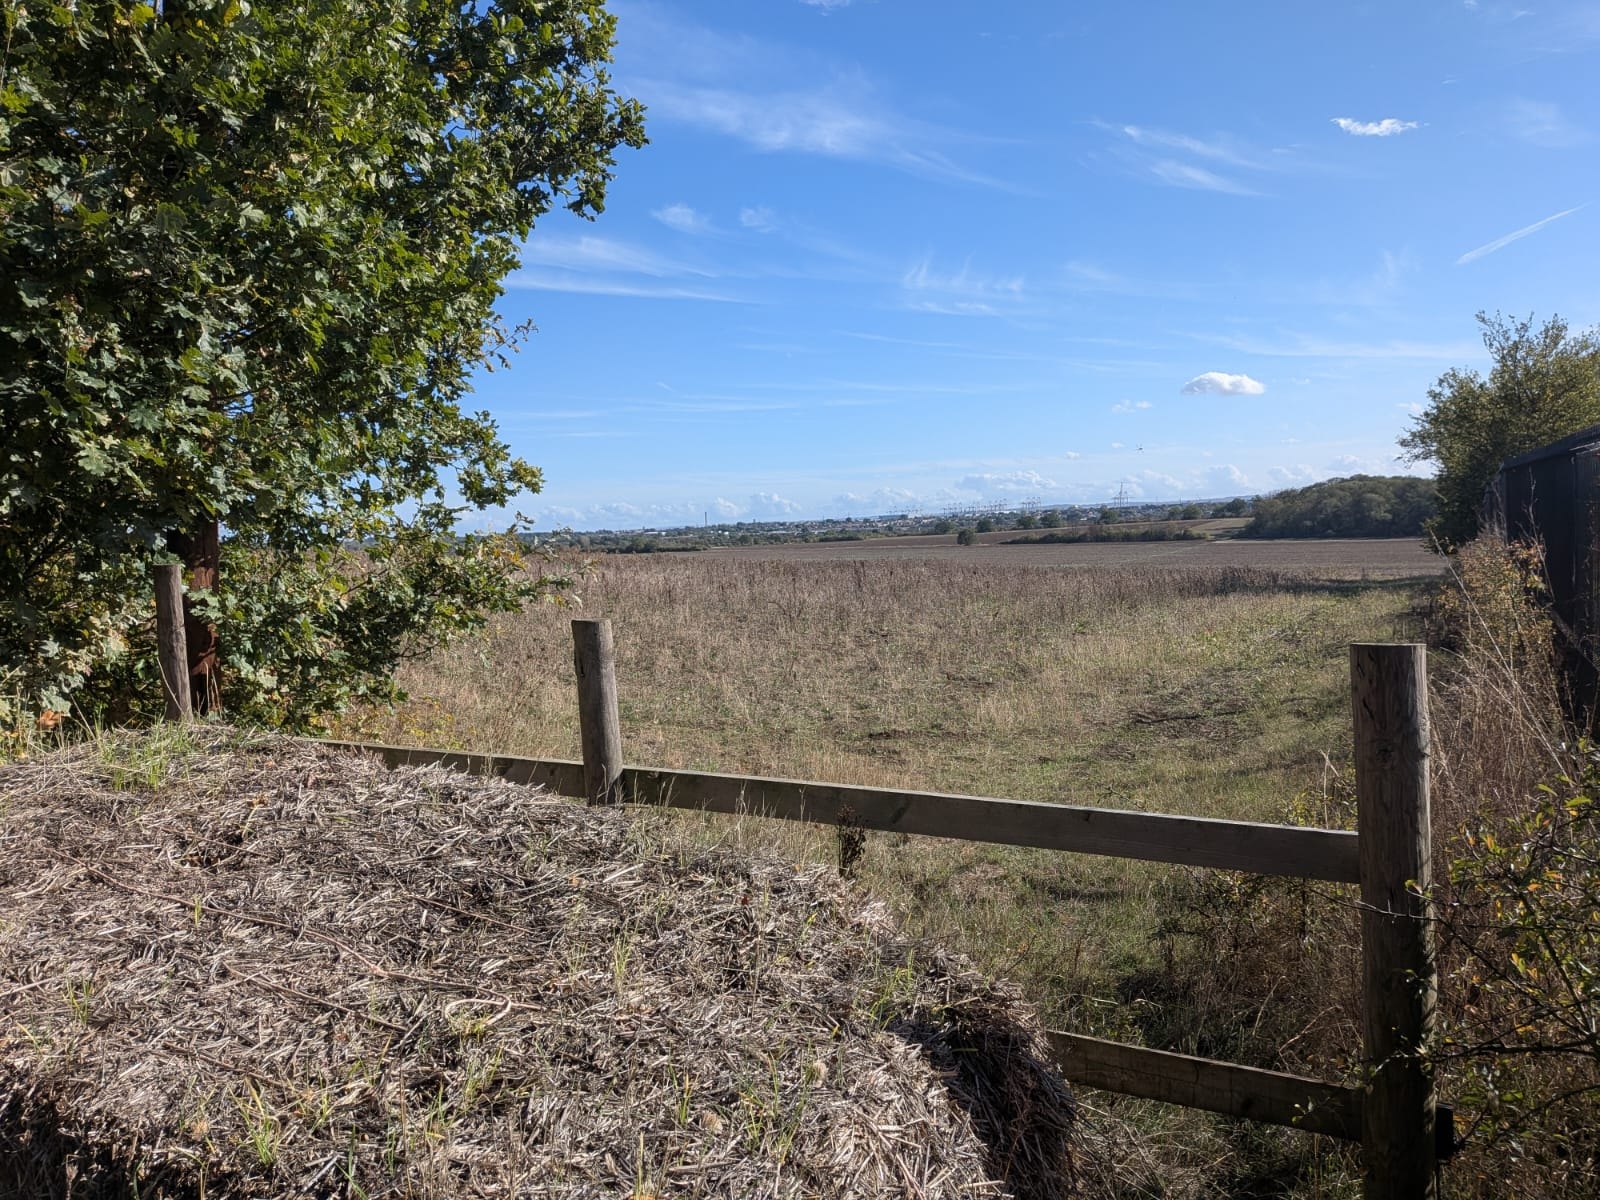
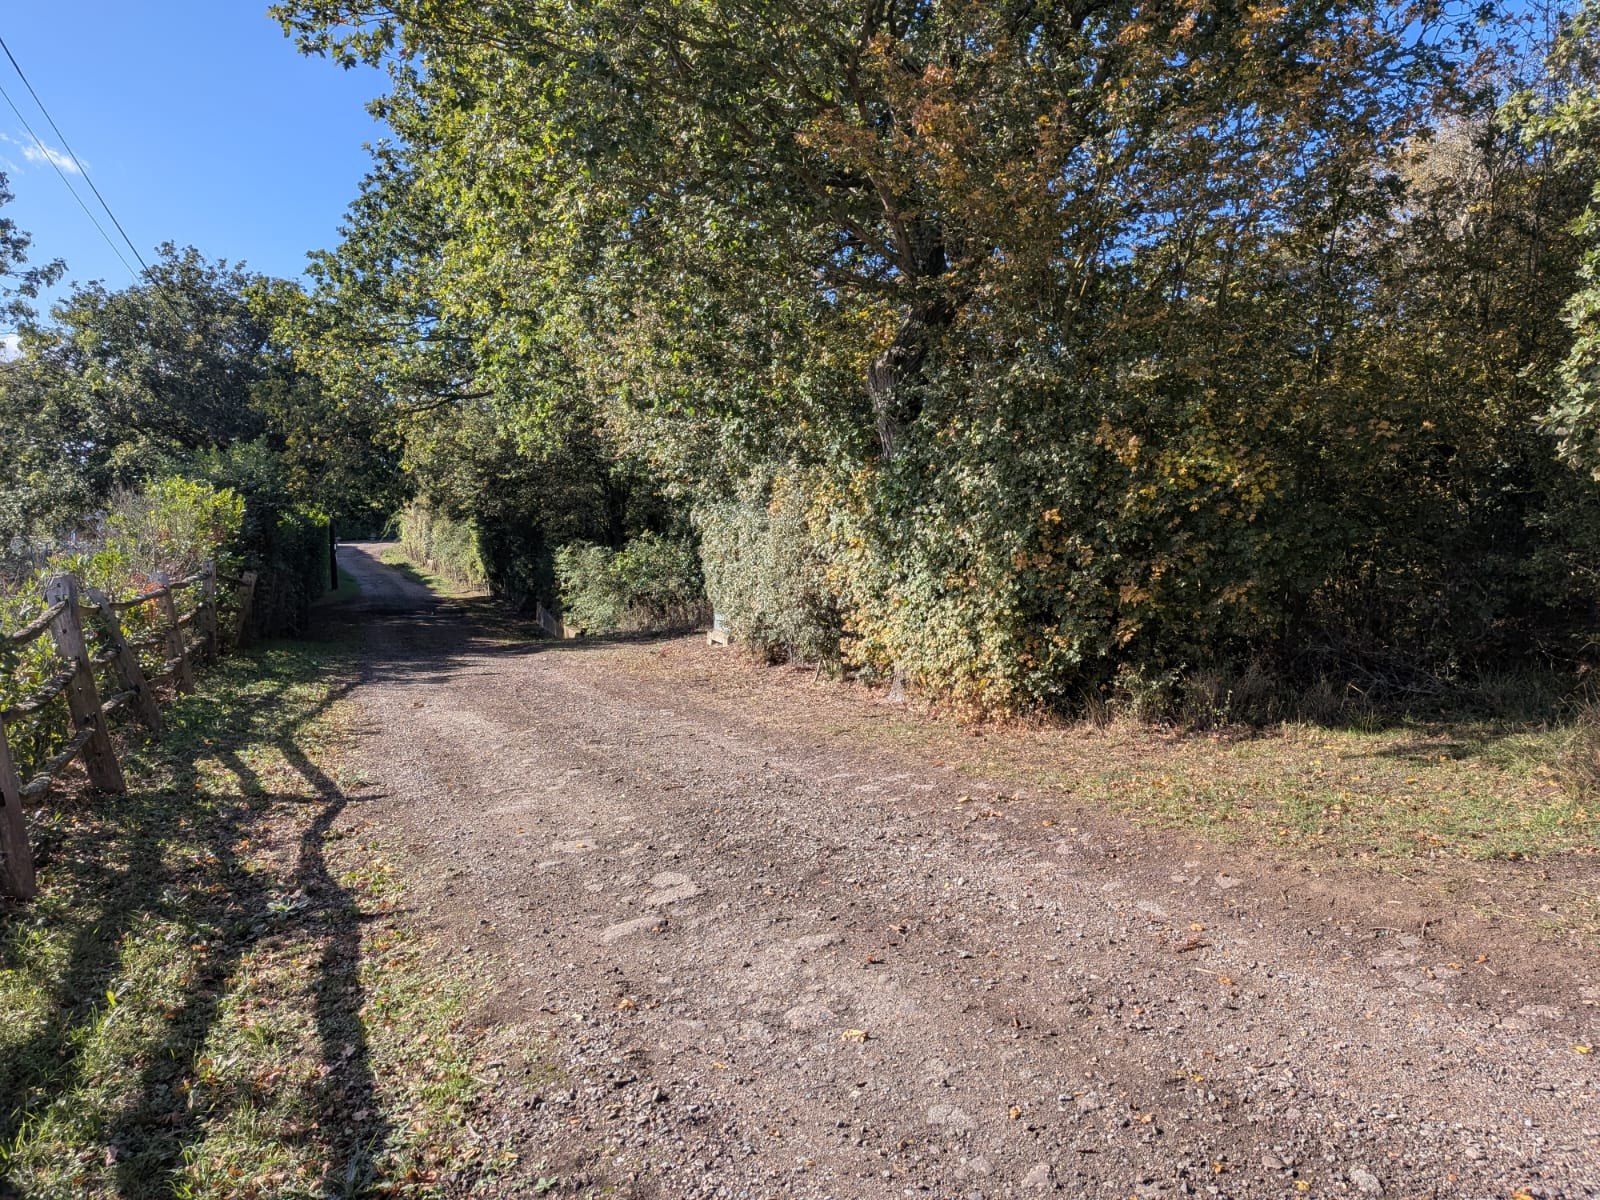
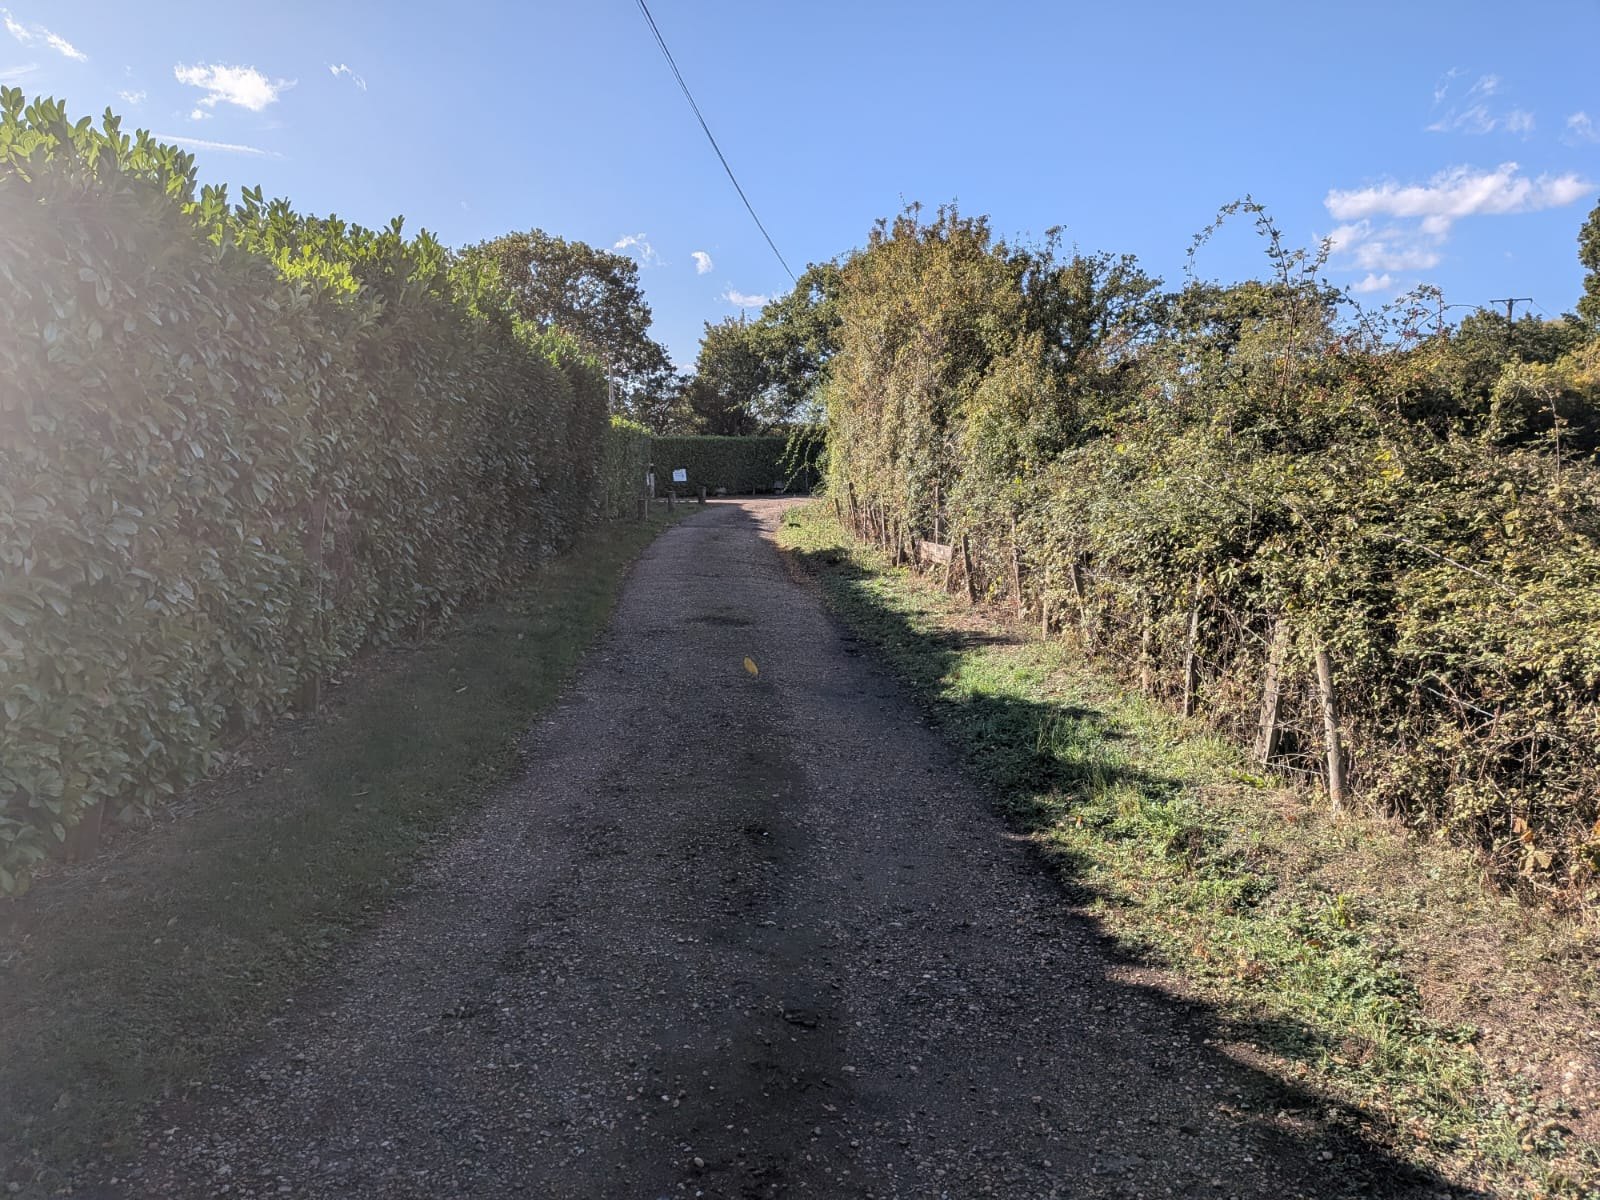
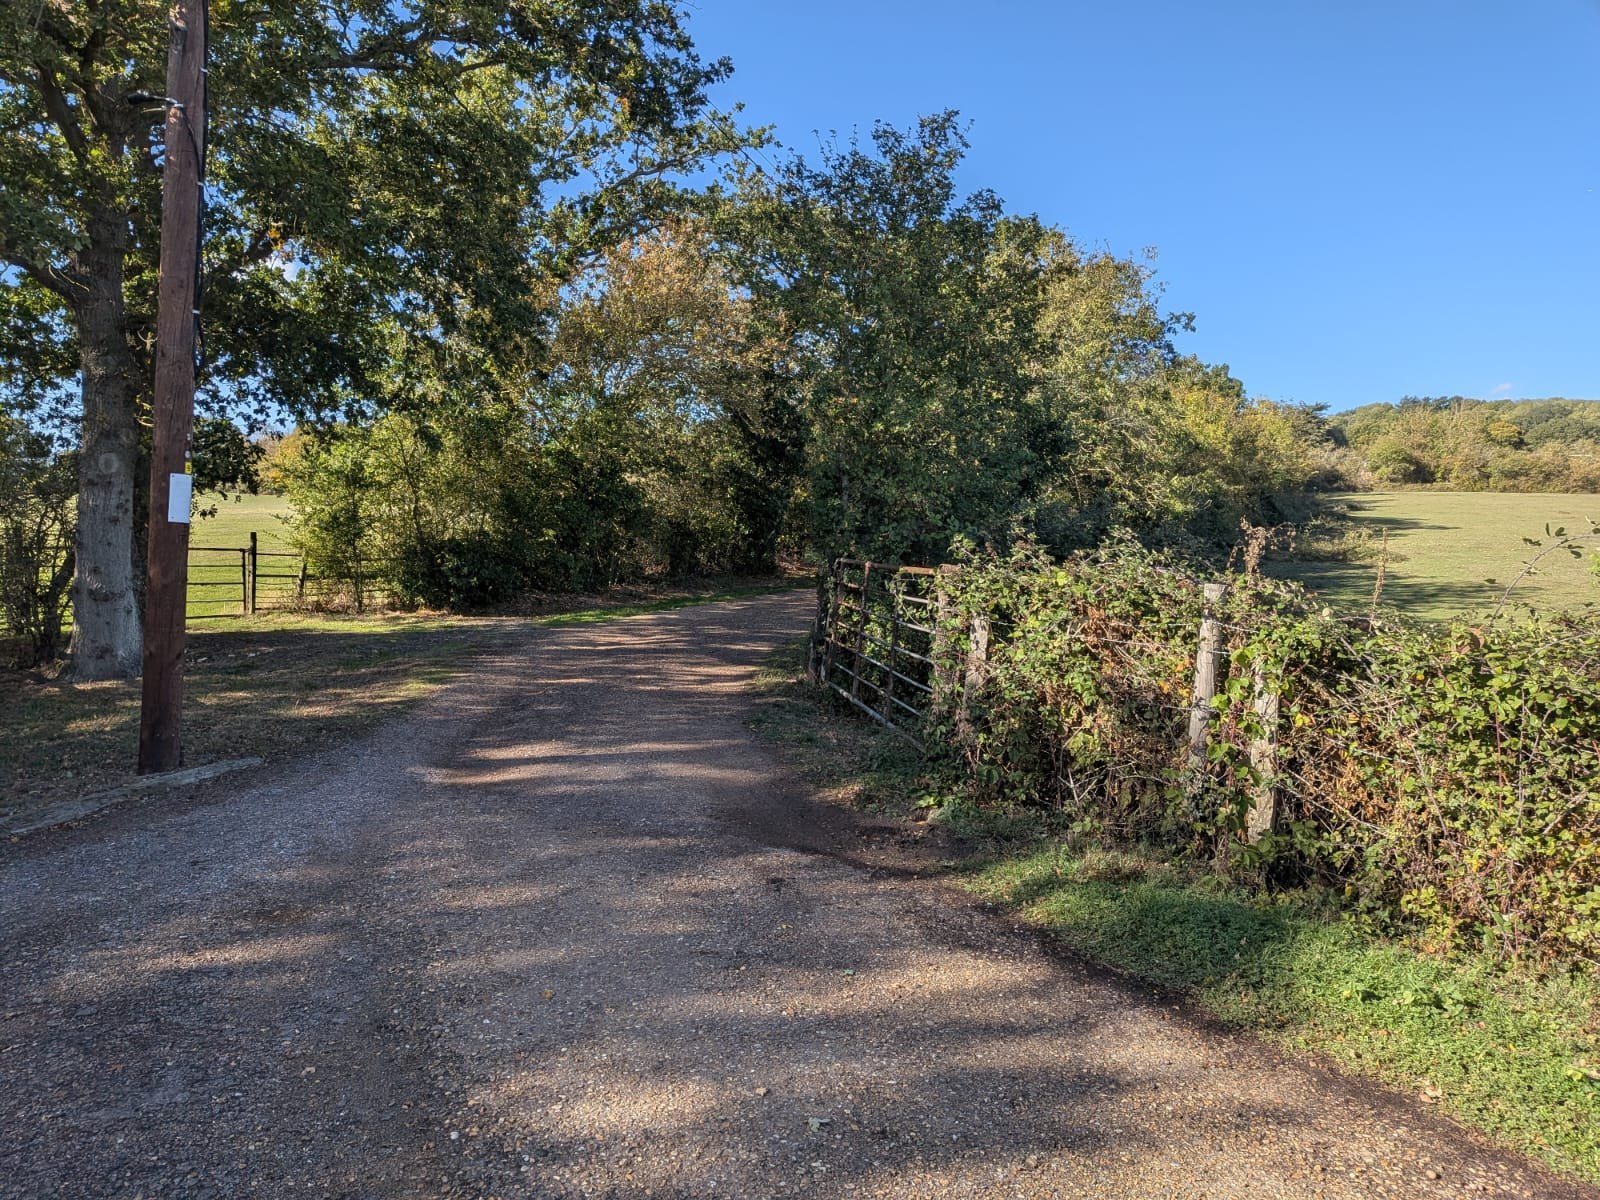
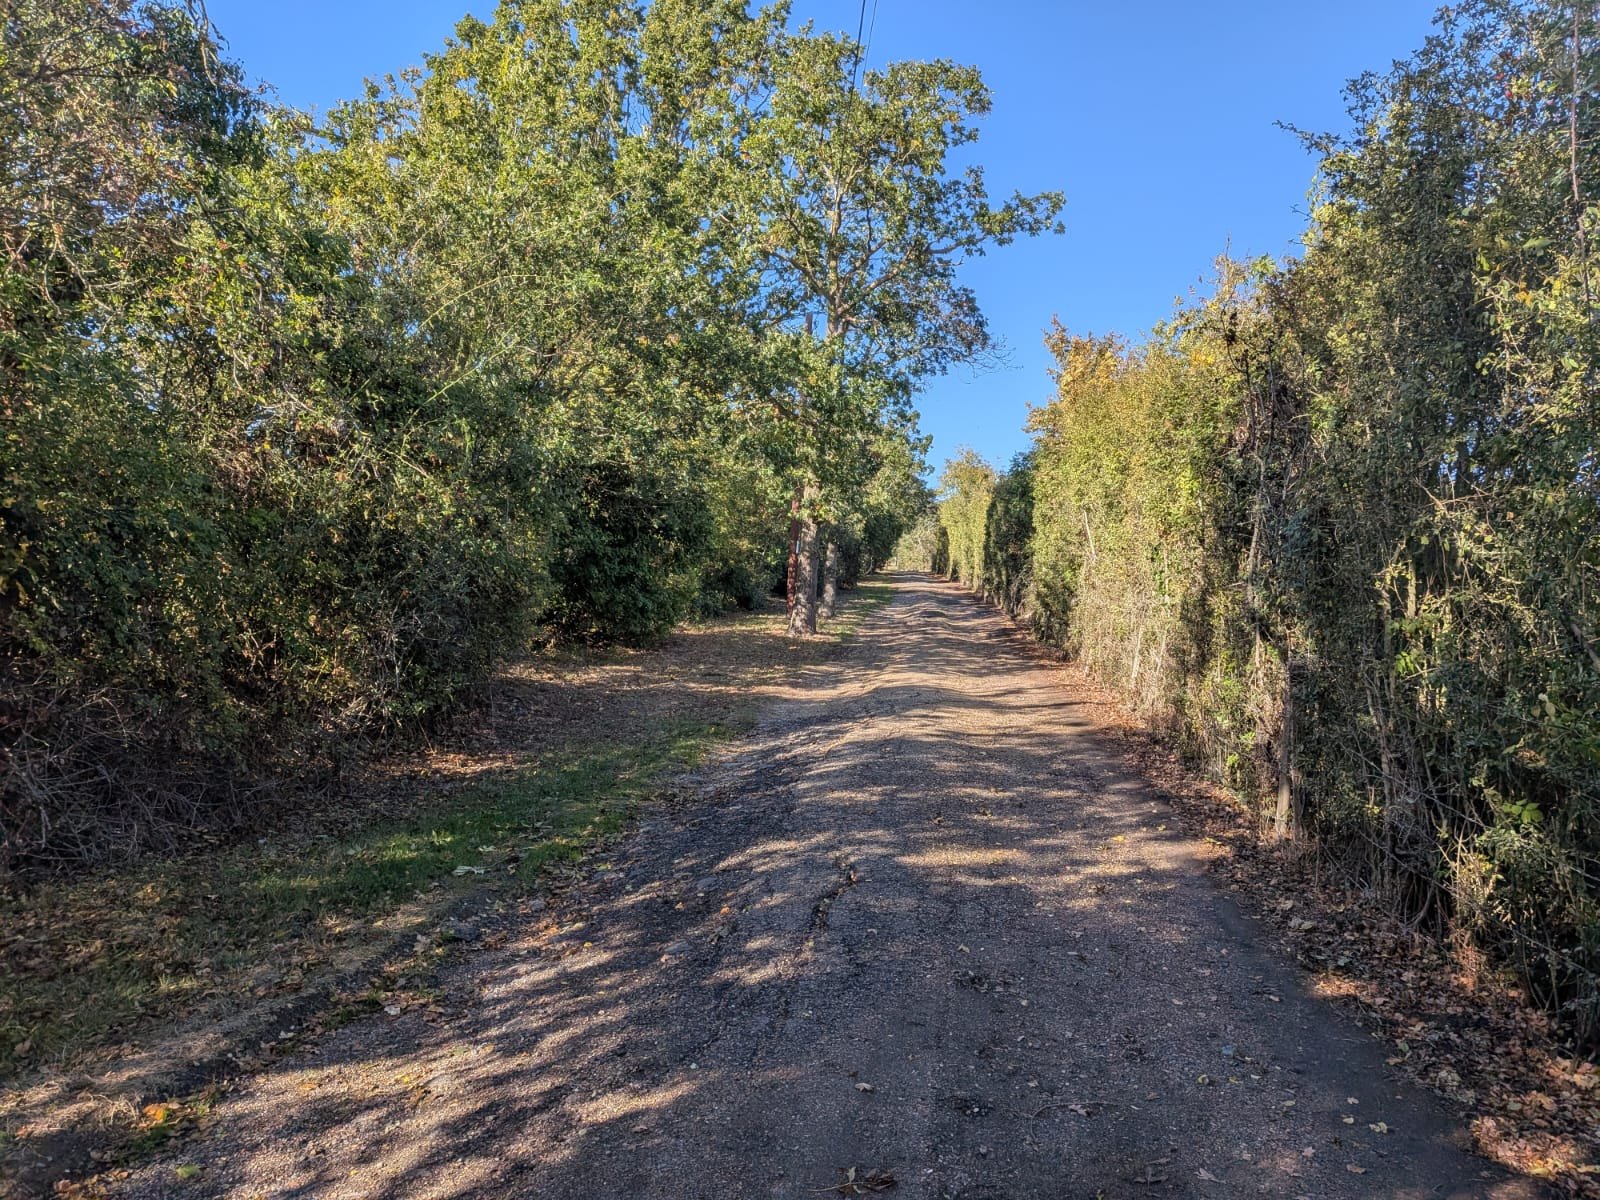
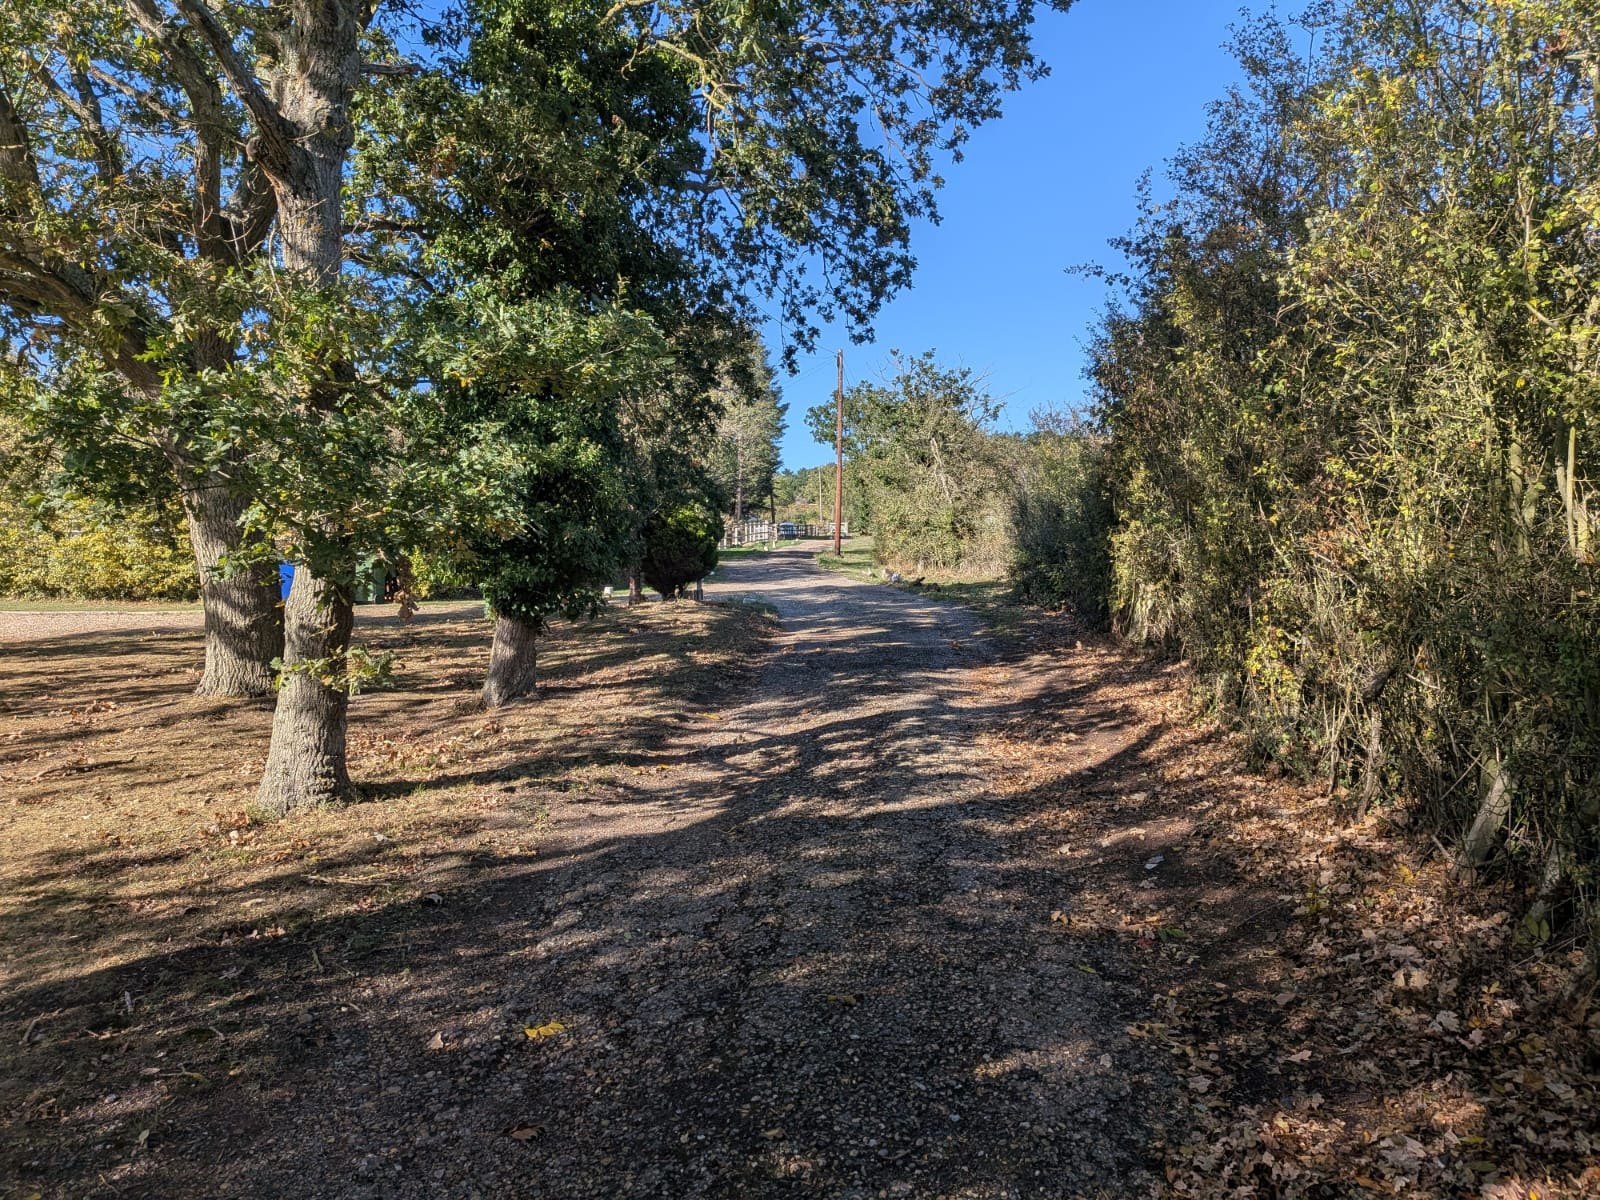
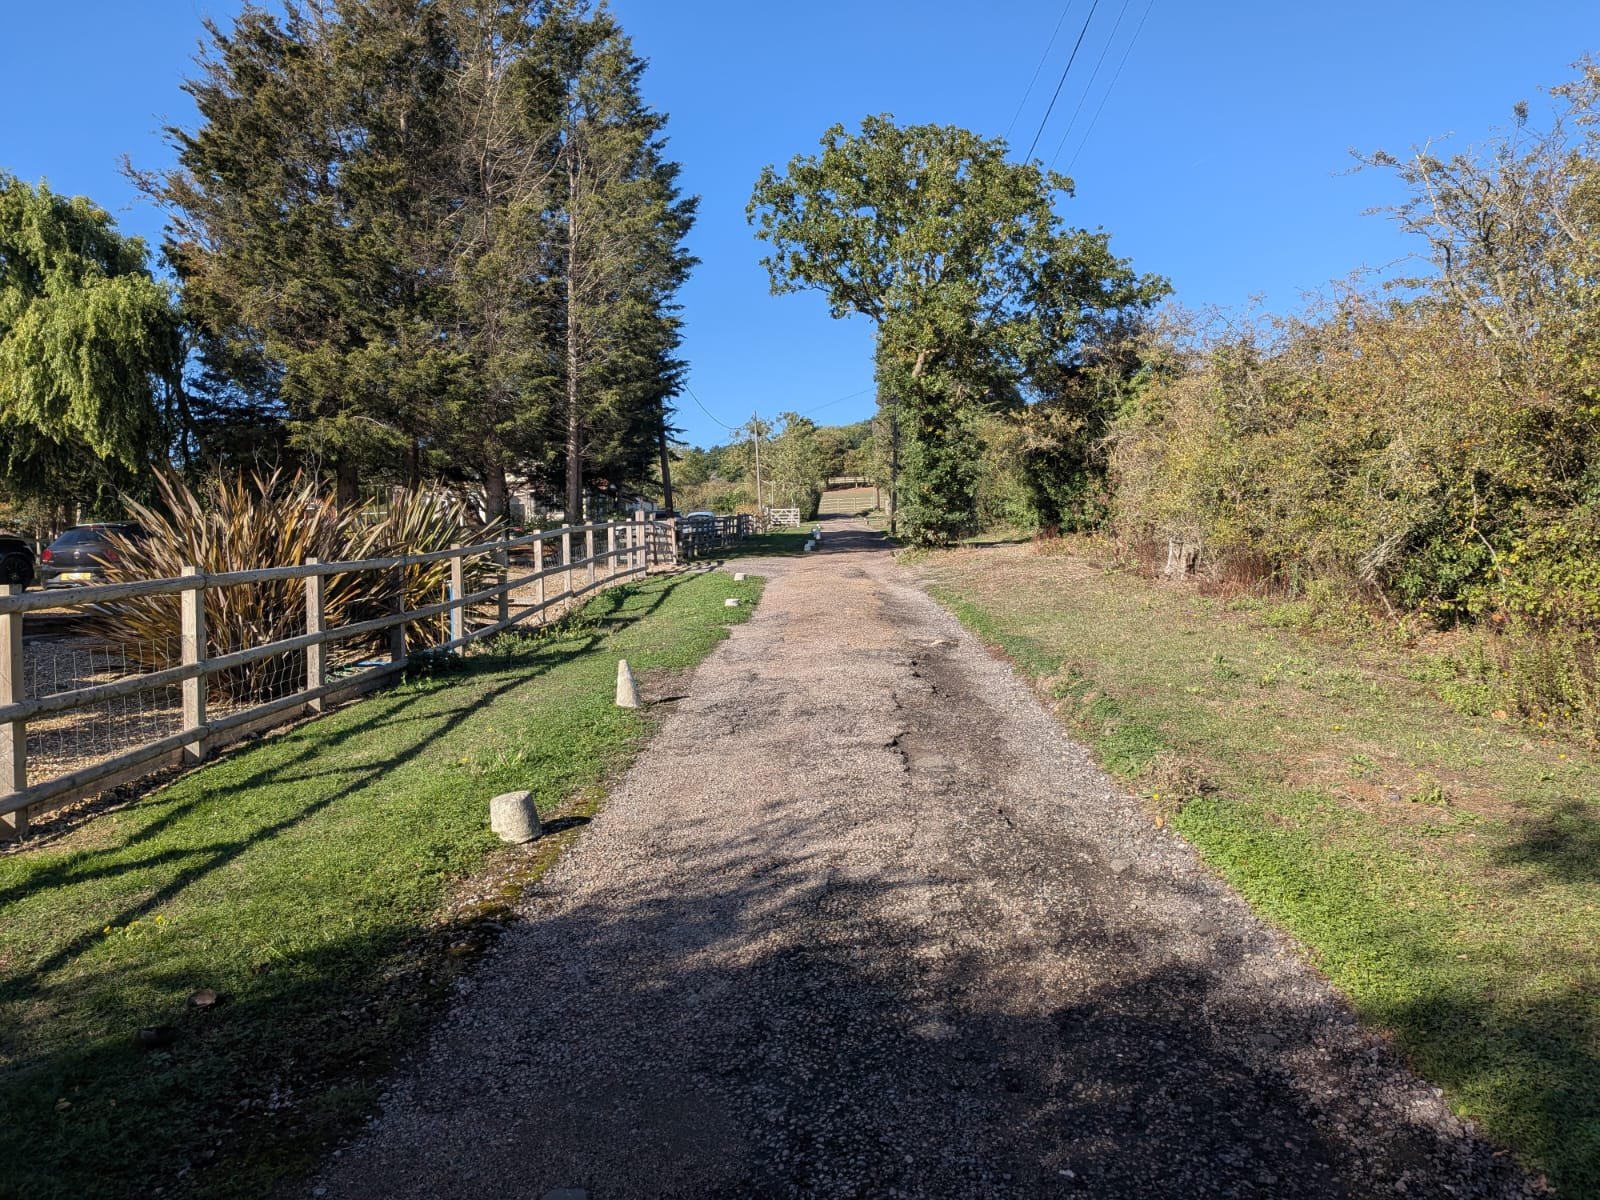
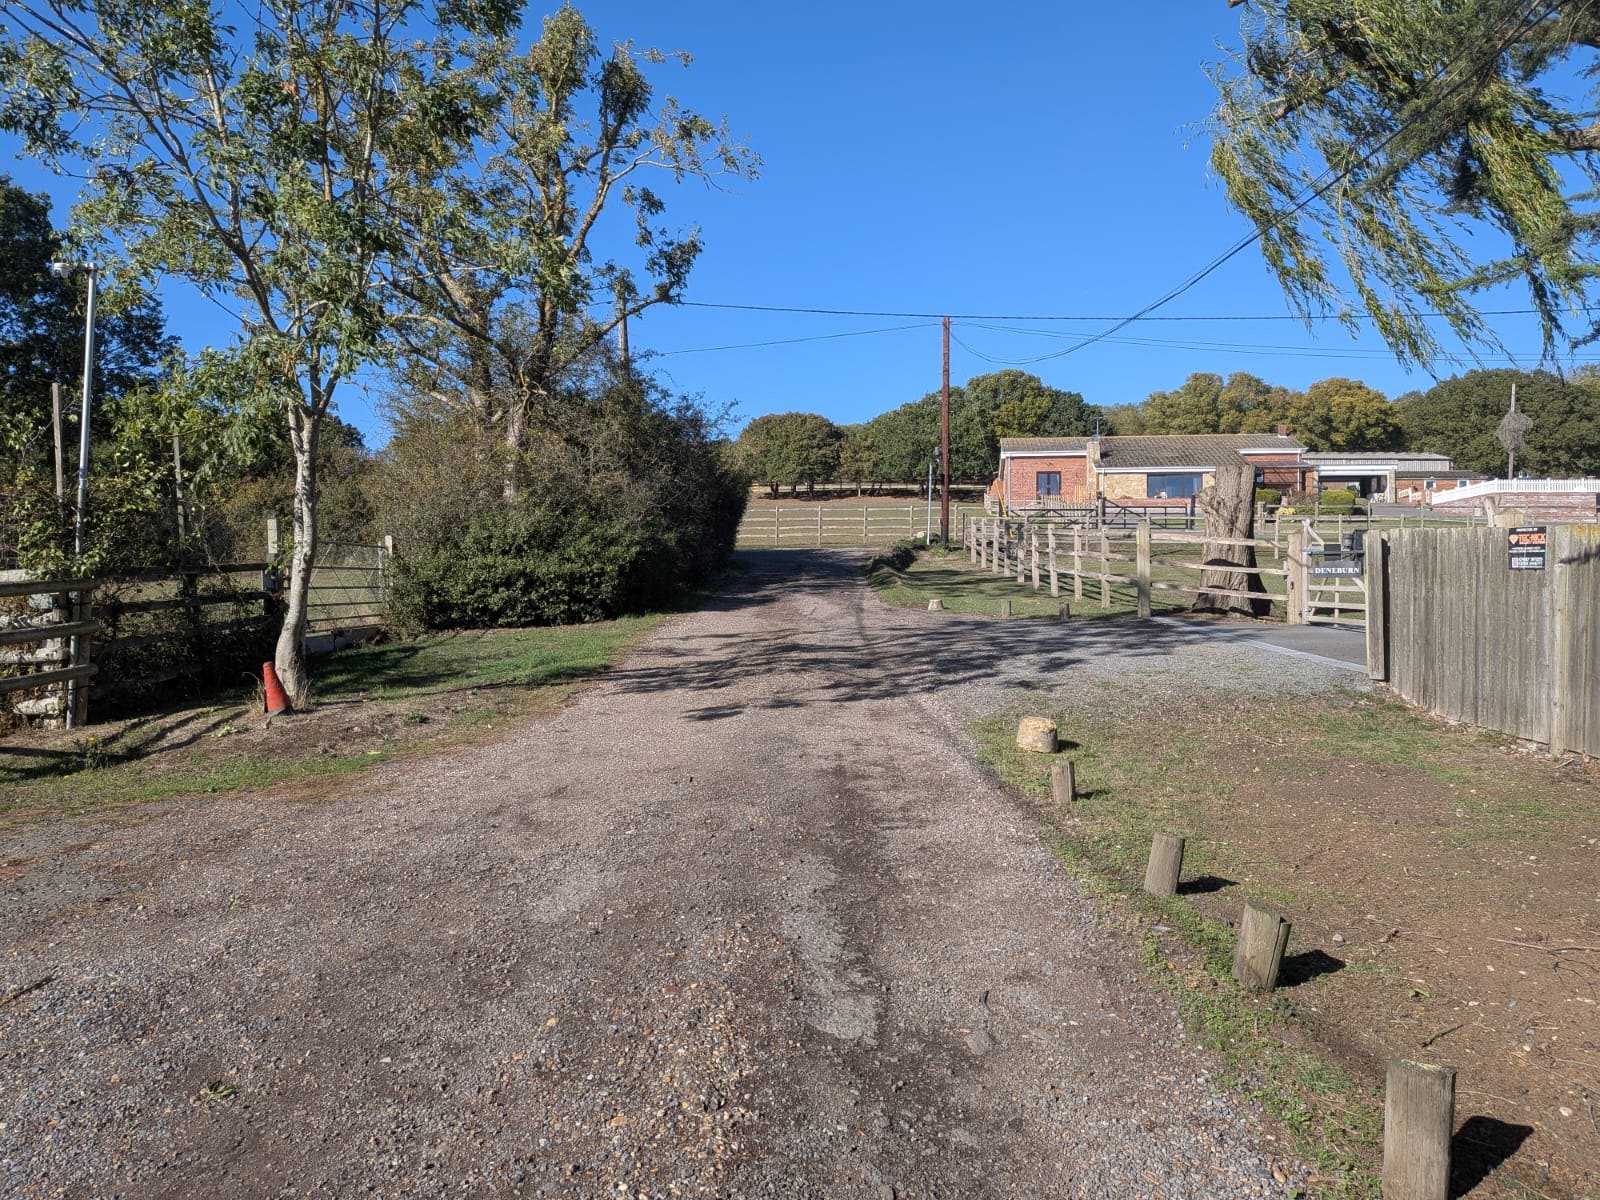
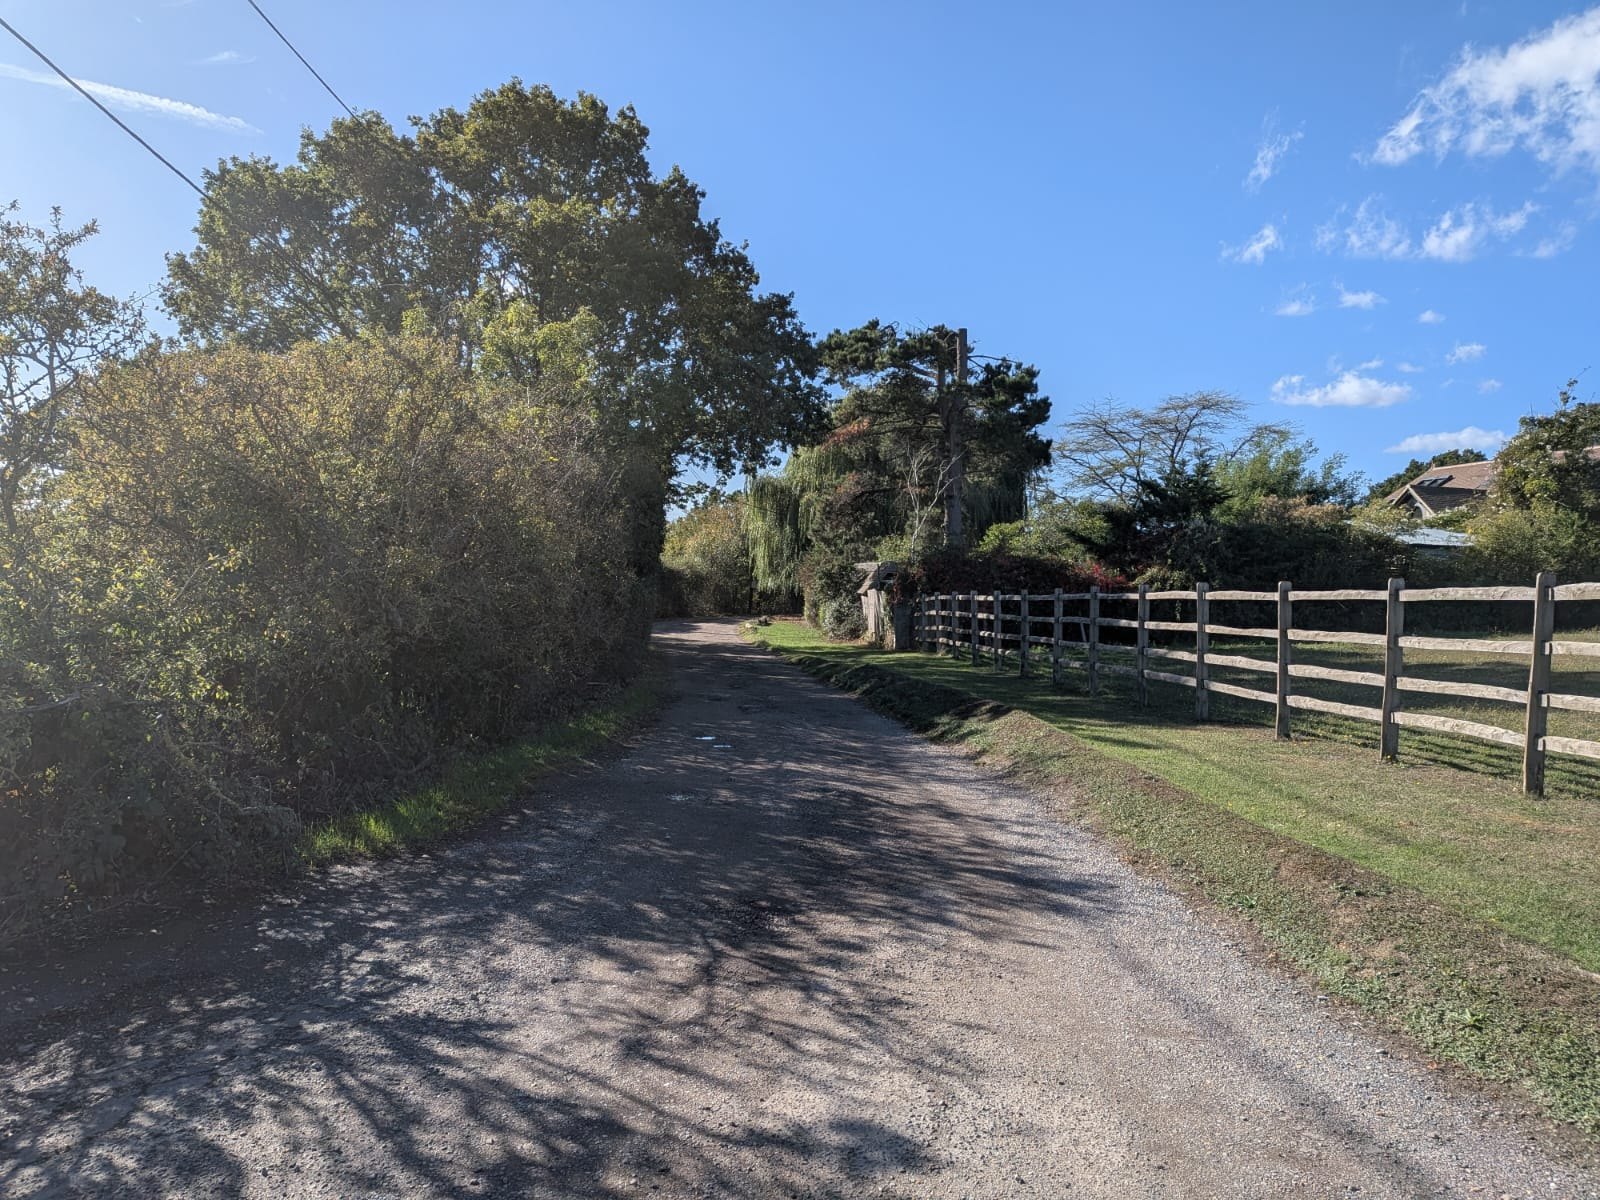
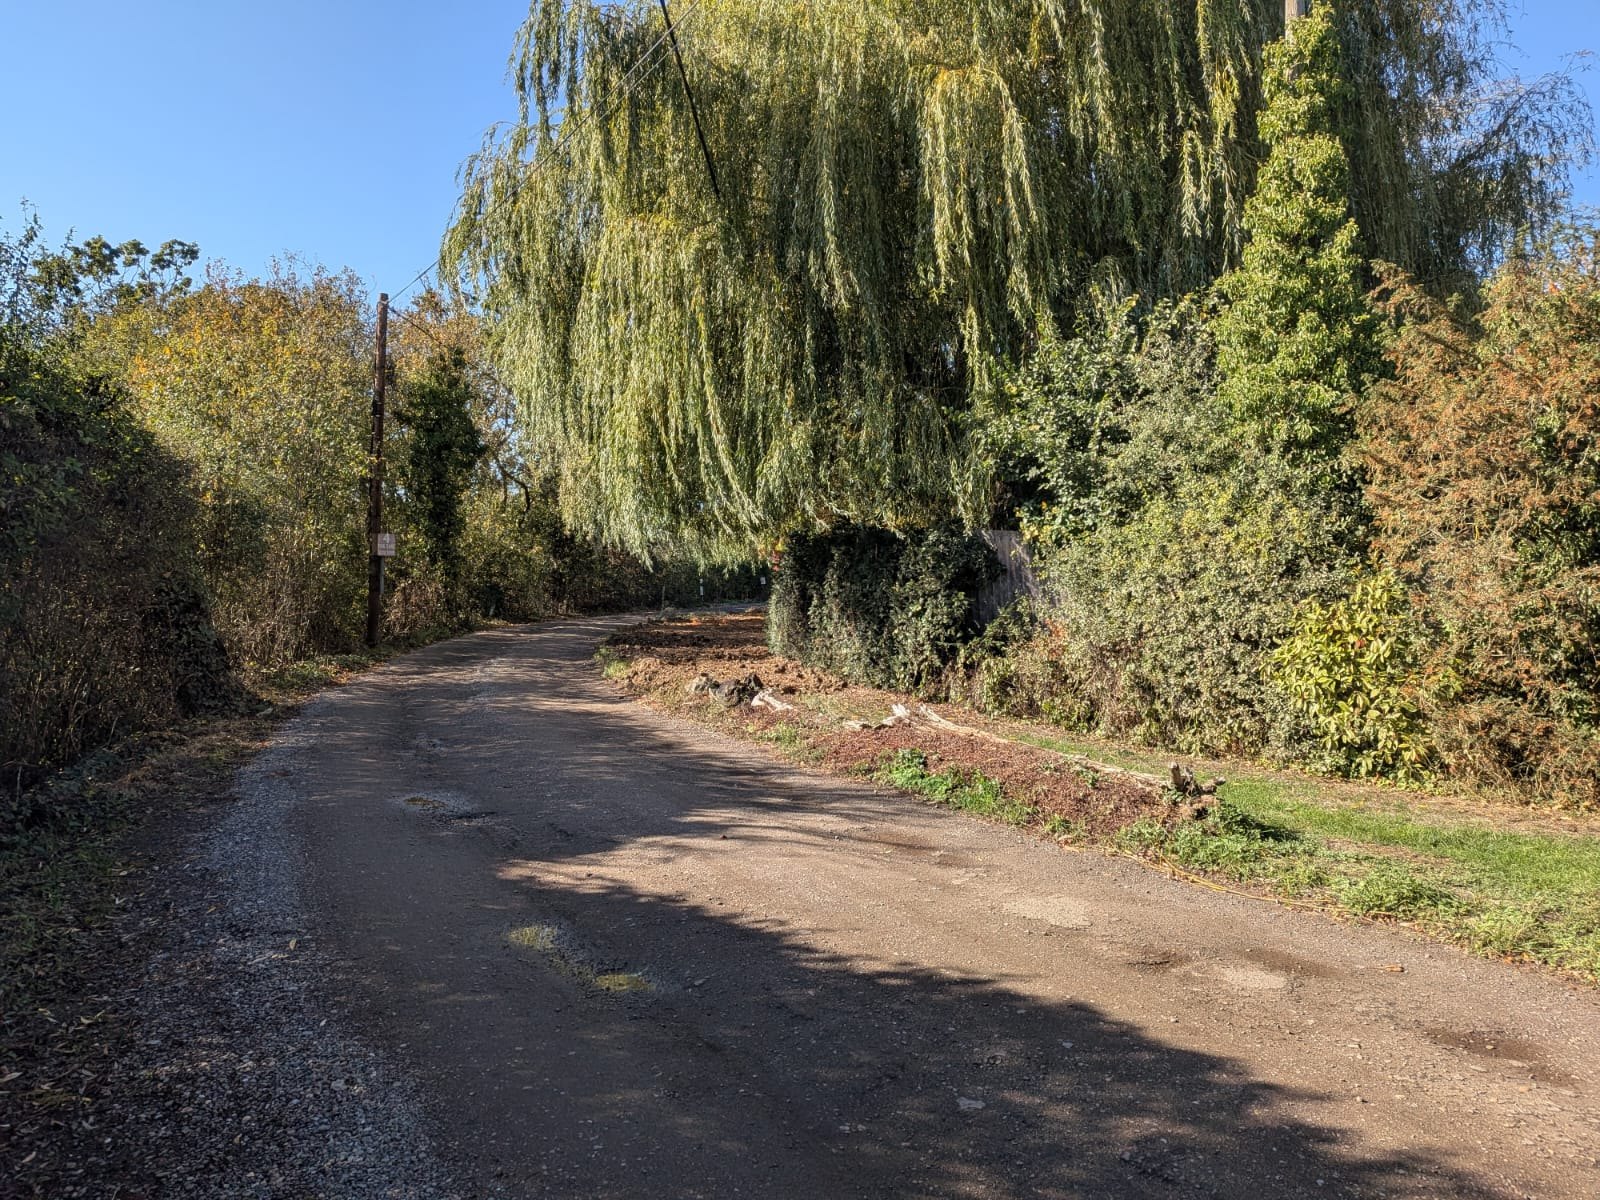
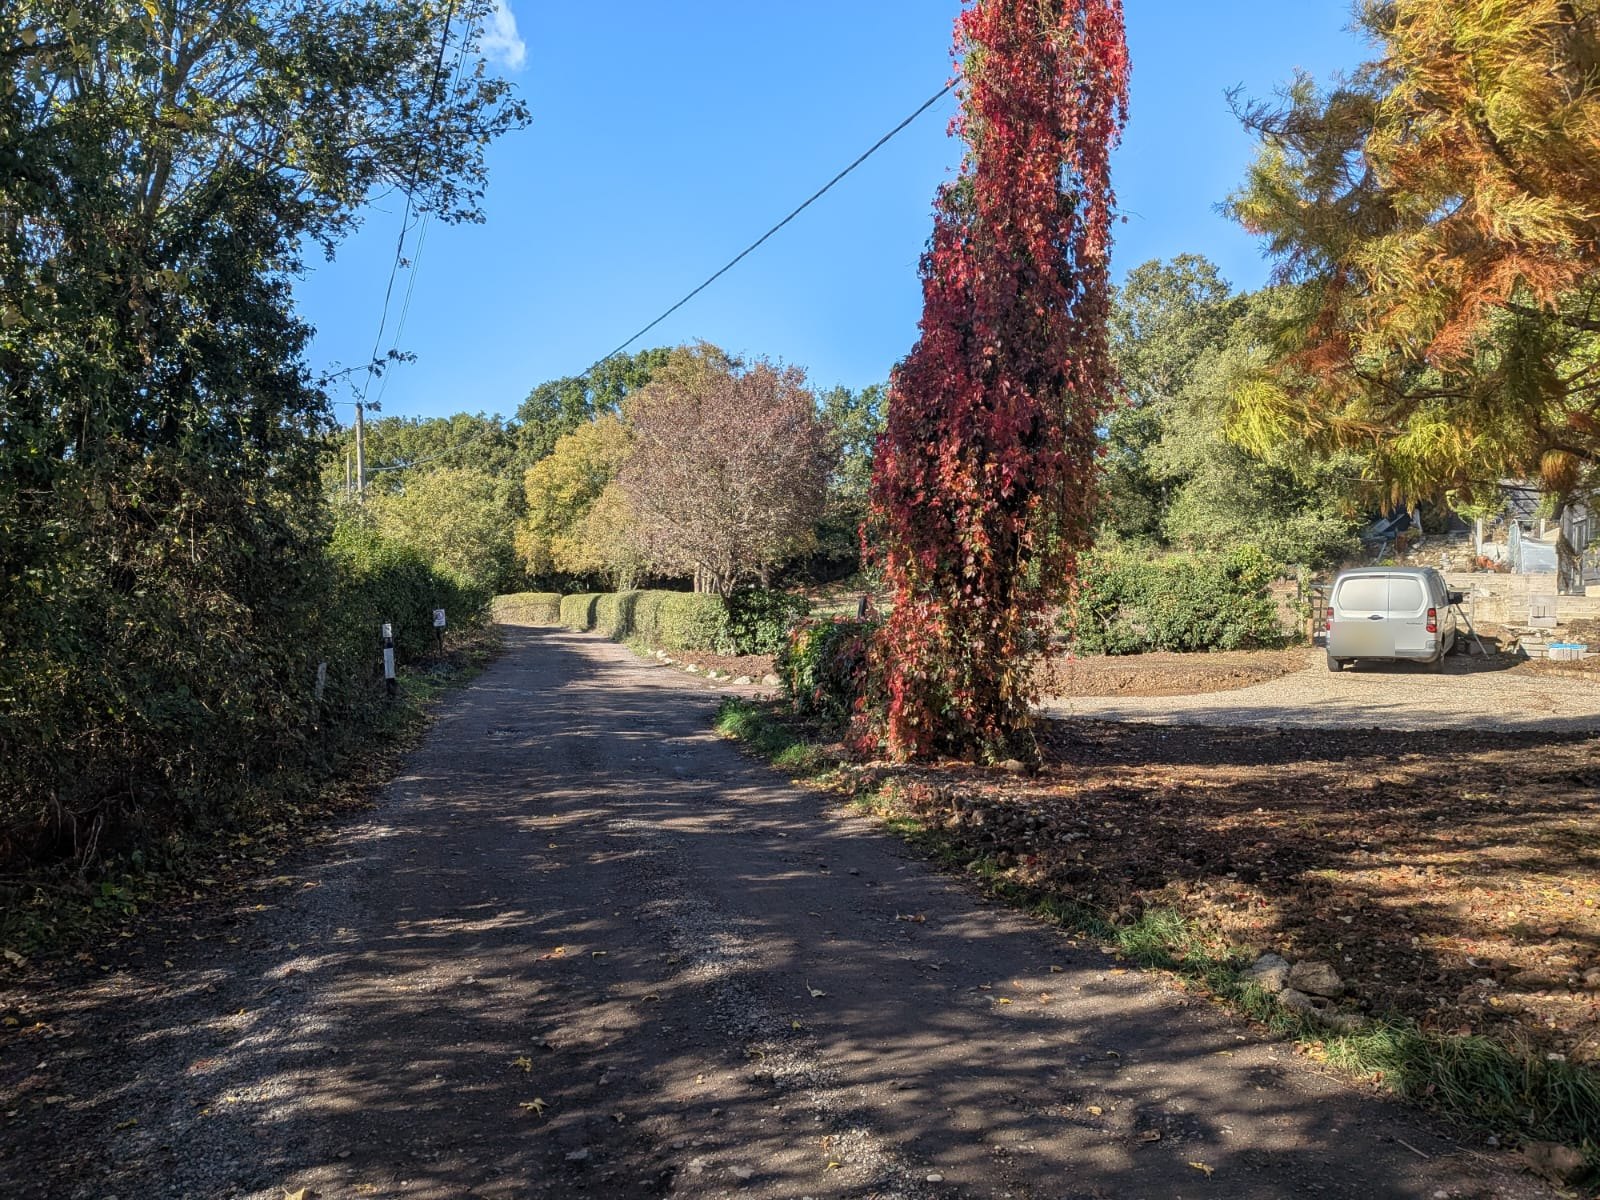
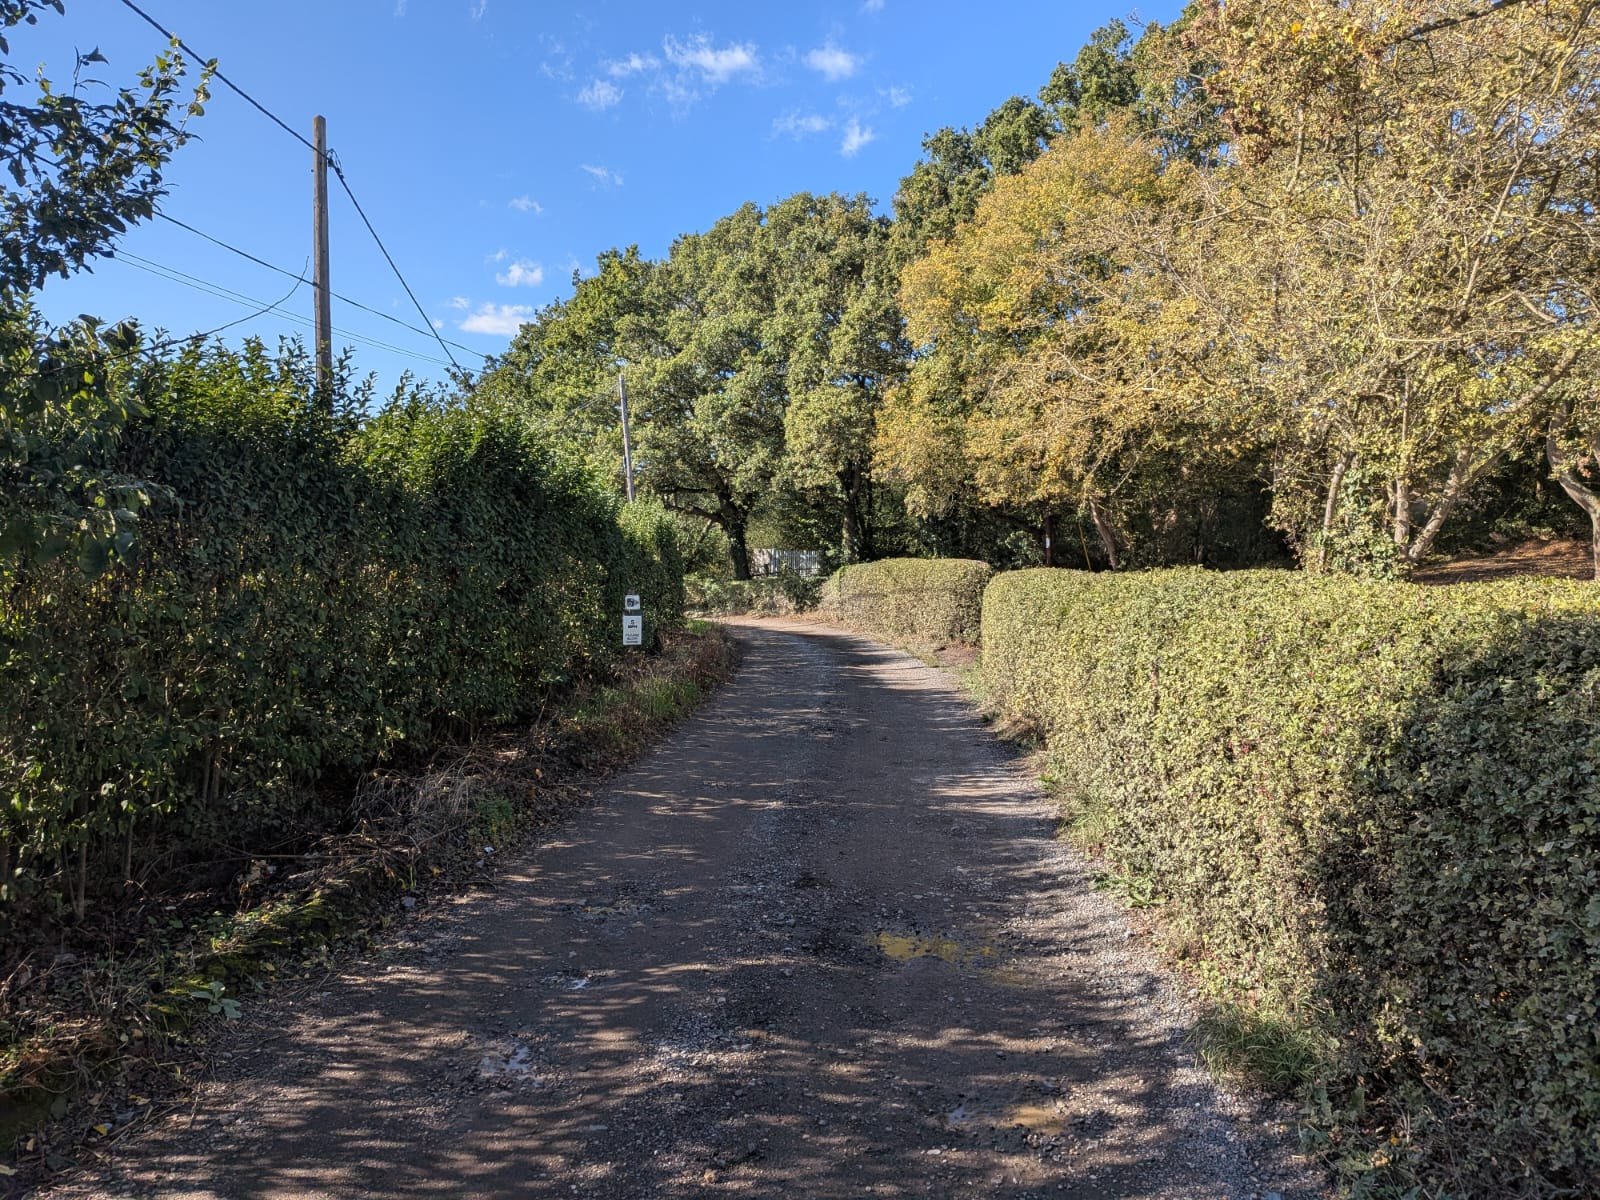
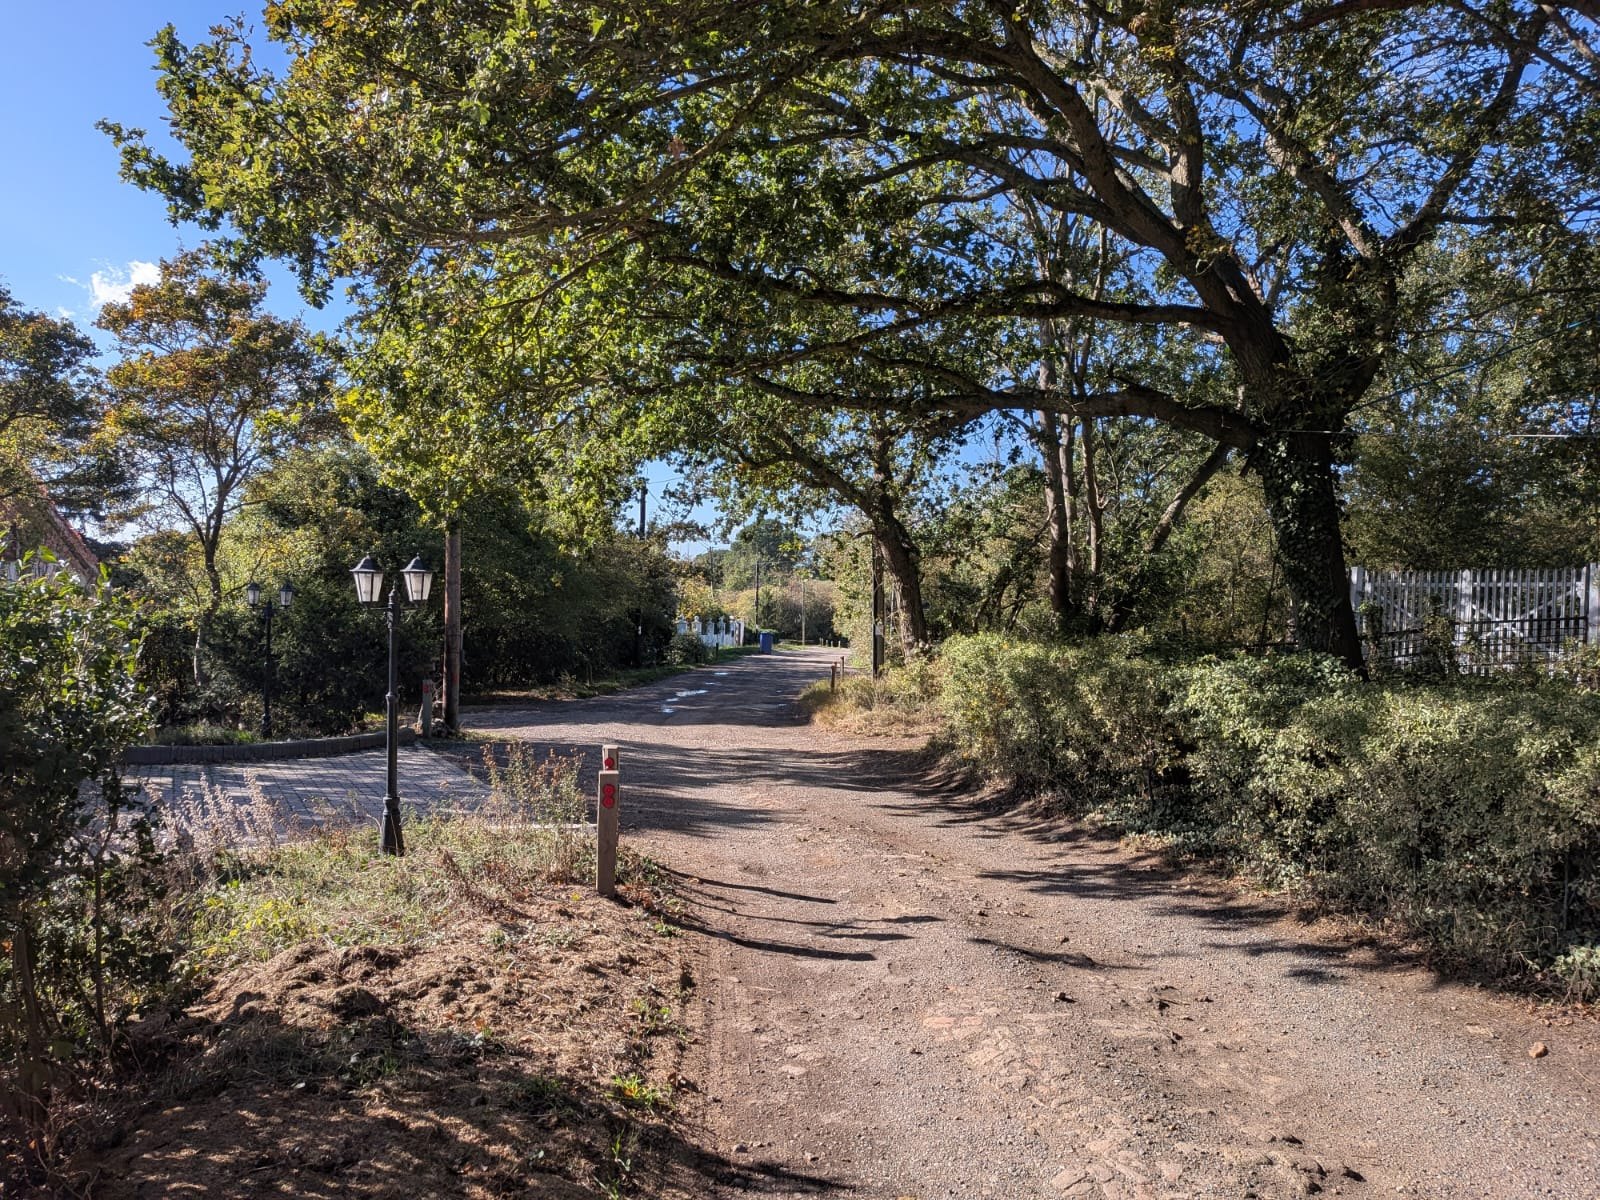
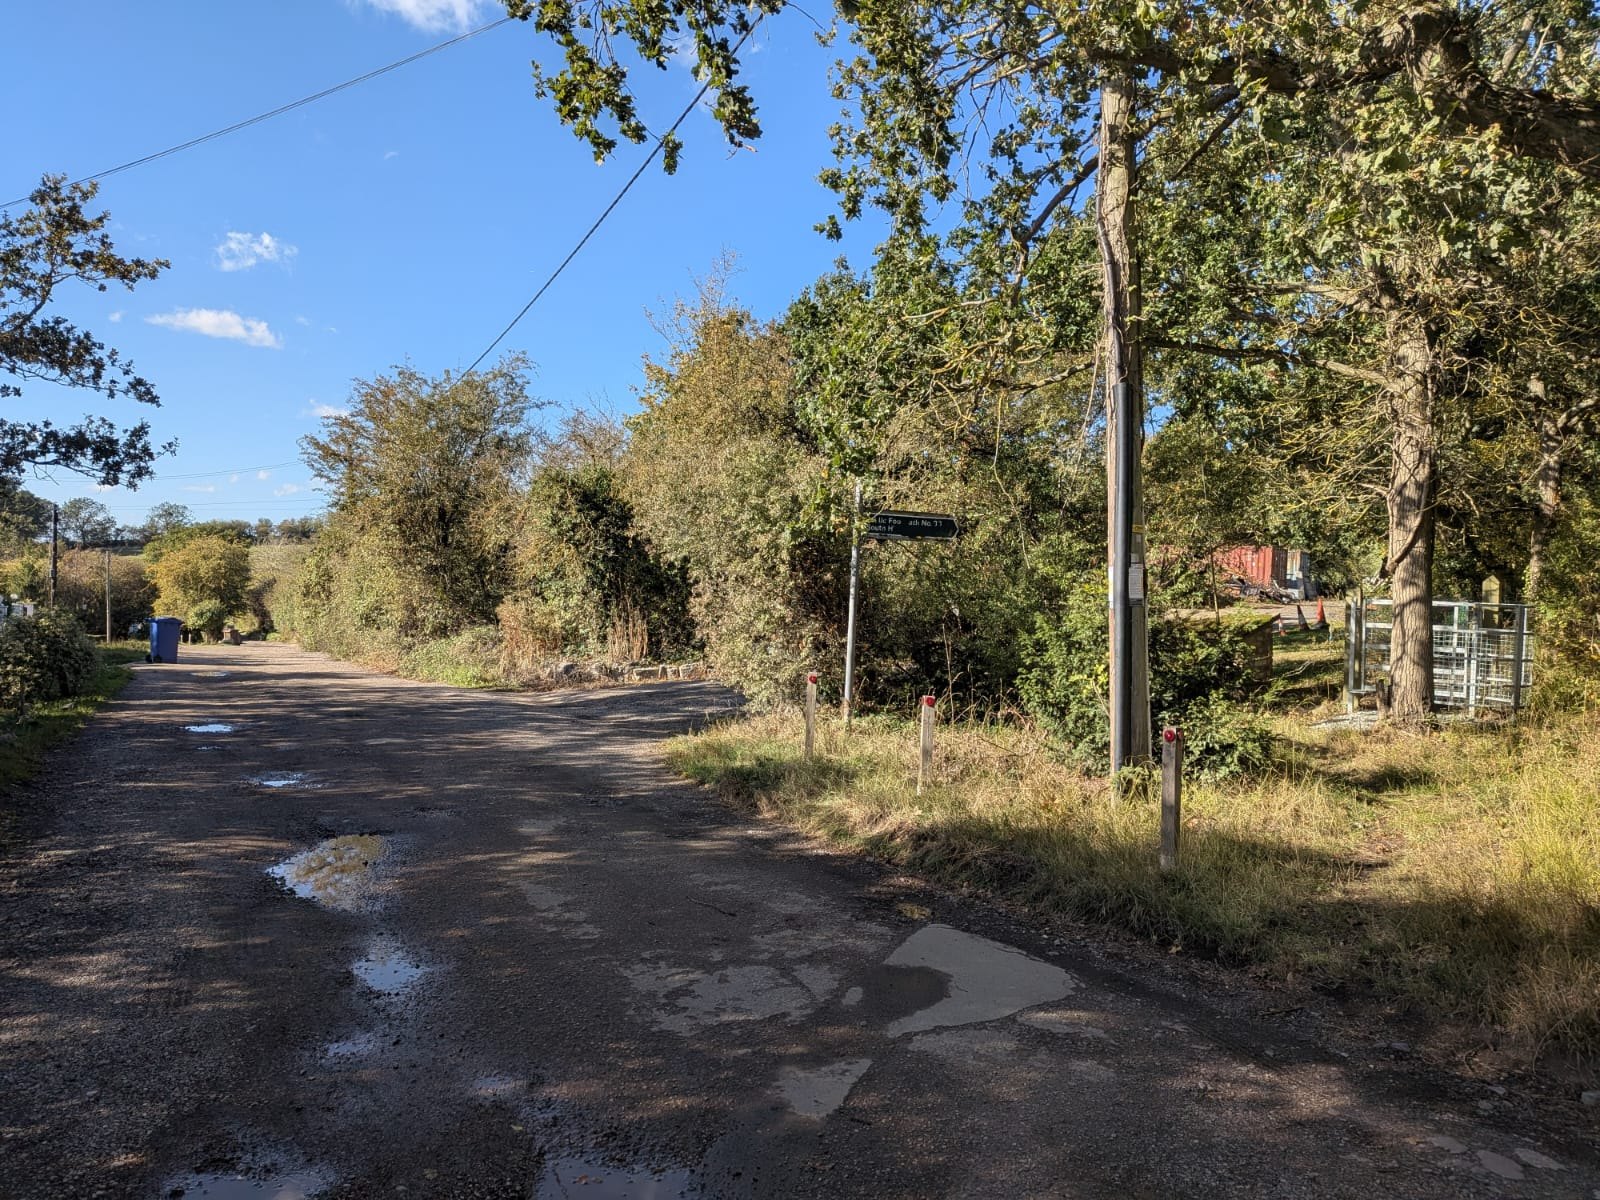
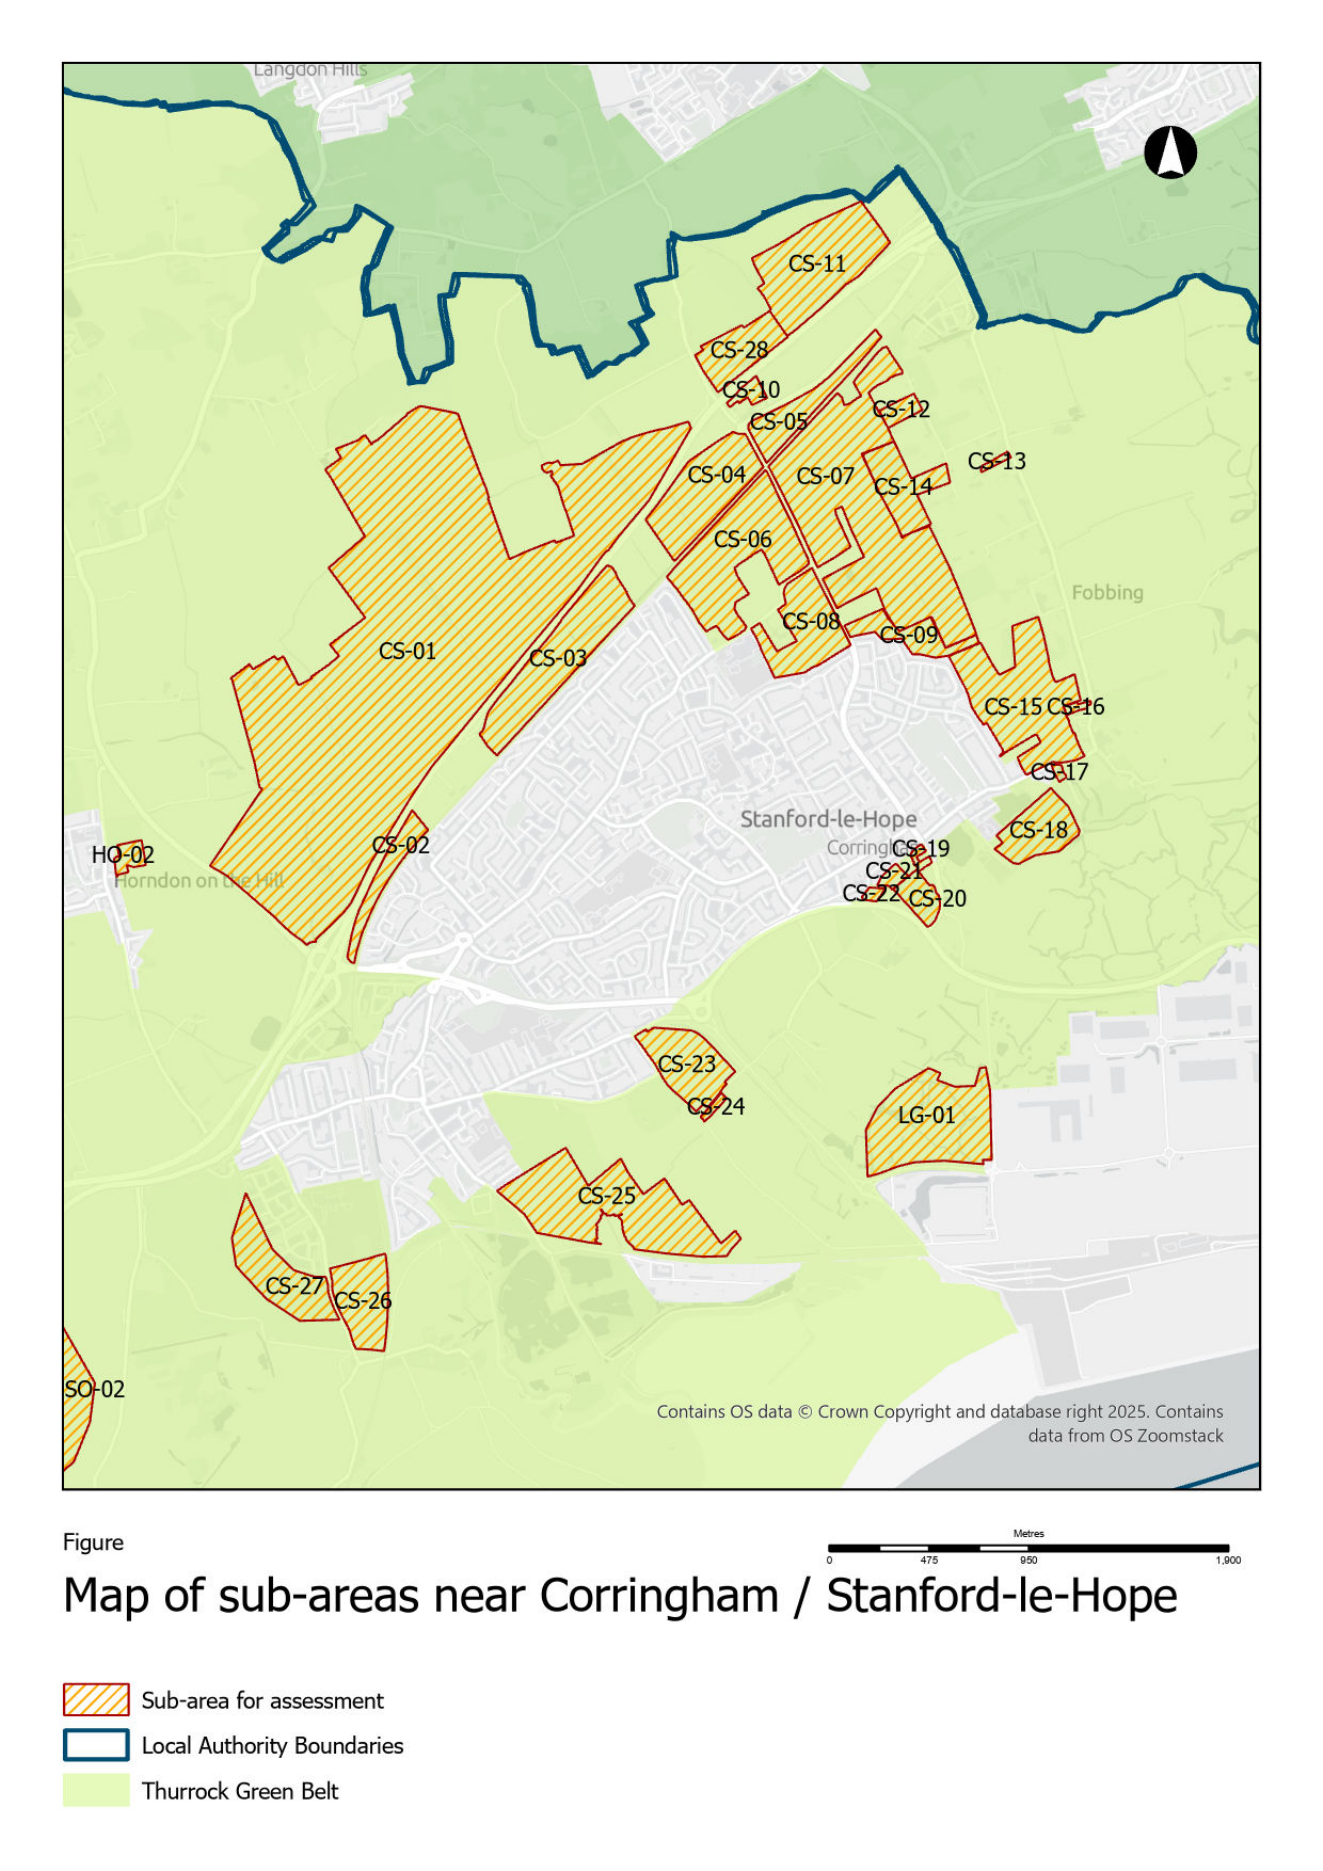
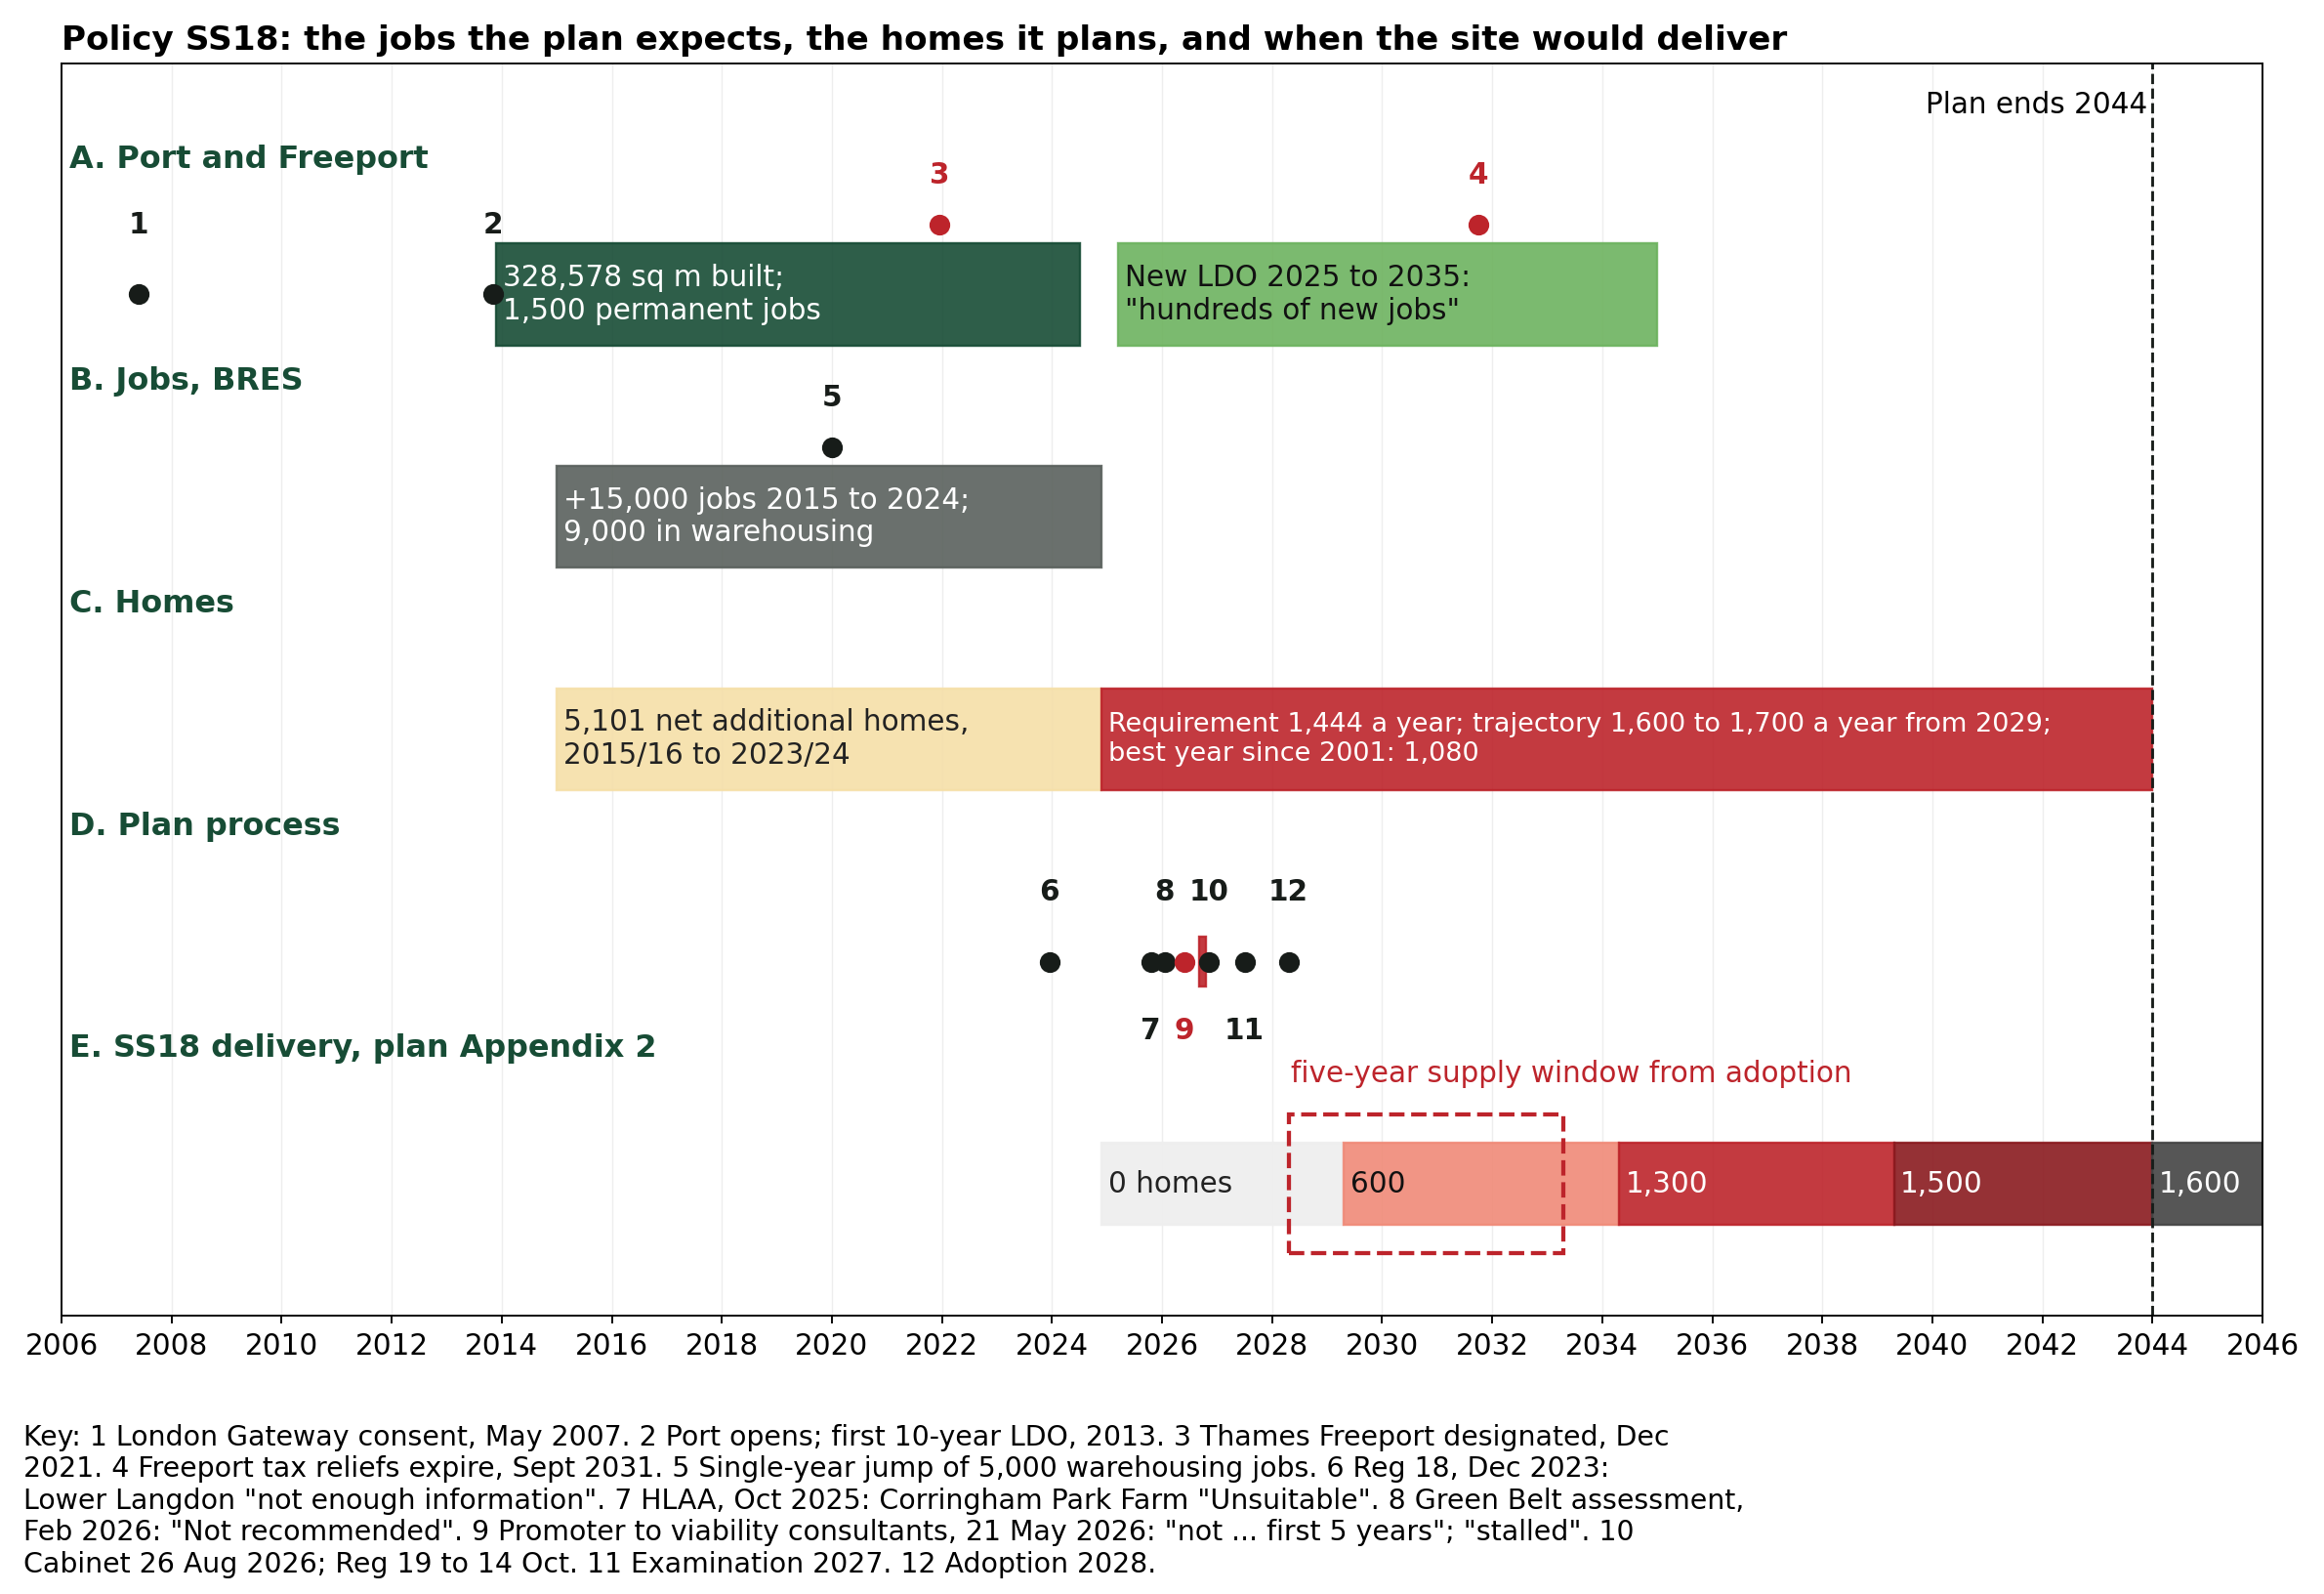
The map of seventy years of refusals on and around the allocation is Figure L1 (Appendix L). The map of the land the Council's scheme can build on, and of the drainage, ancient woodland and SSSI buffers that must also be set aside, is Figure 2 (section 4.4). The flow paths through the allocation are Figure O1 (Appendix O).
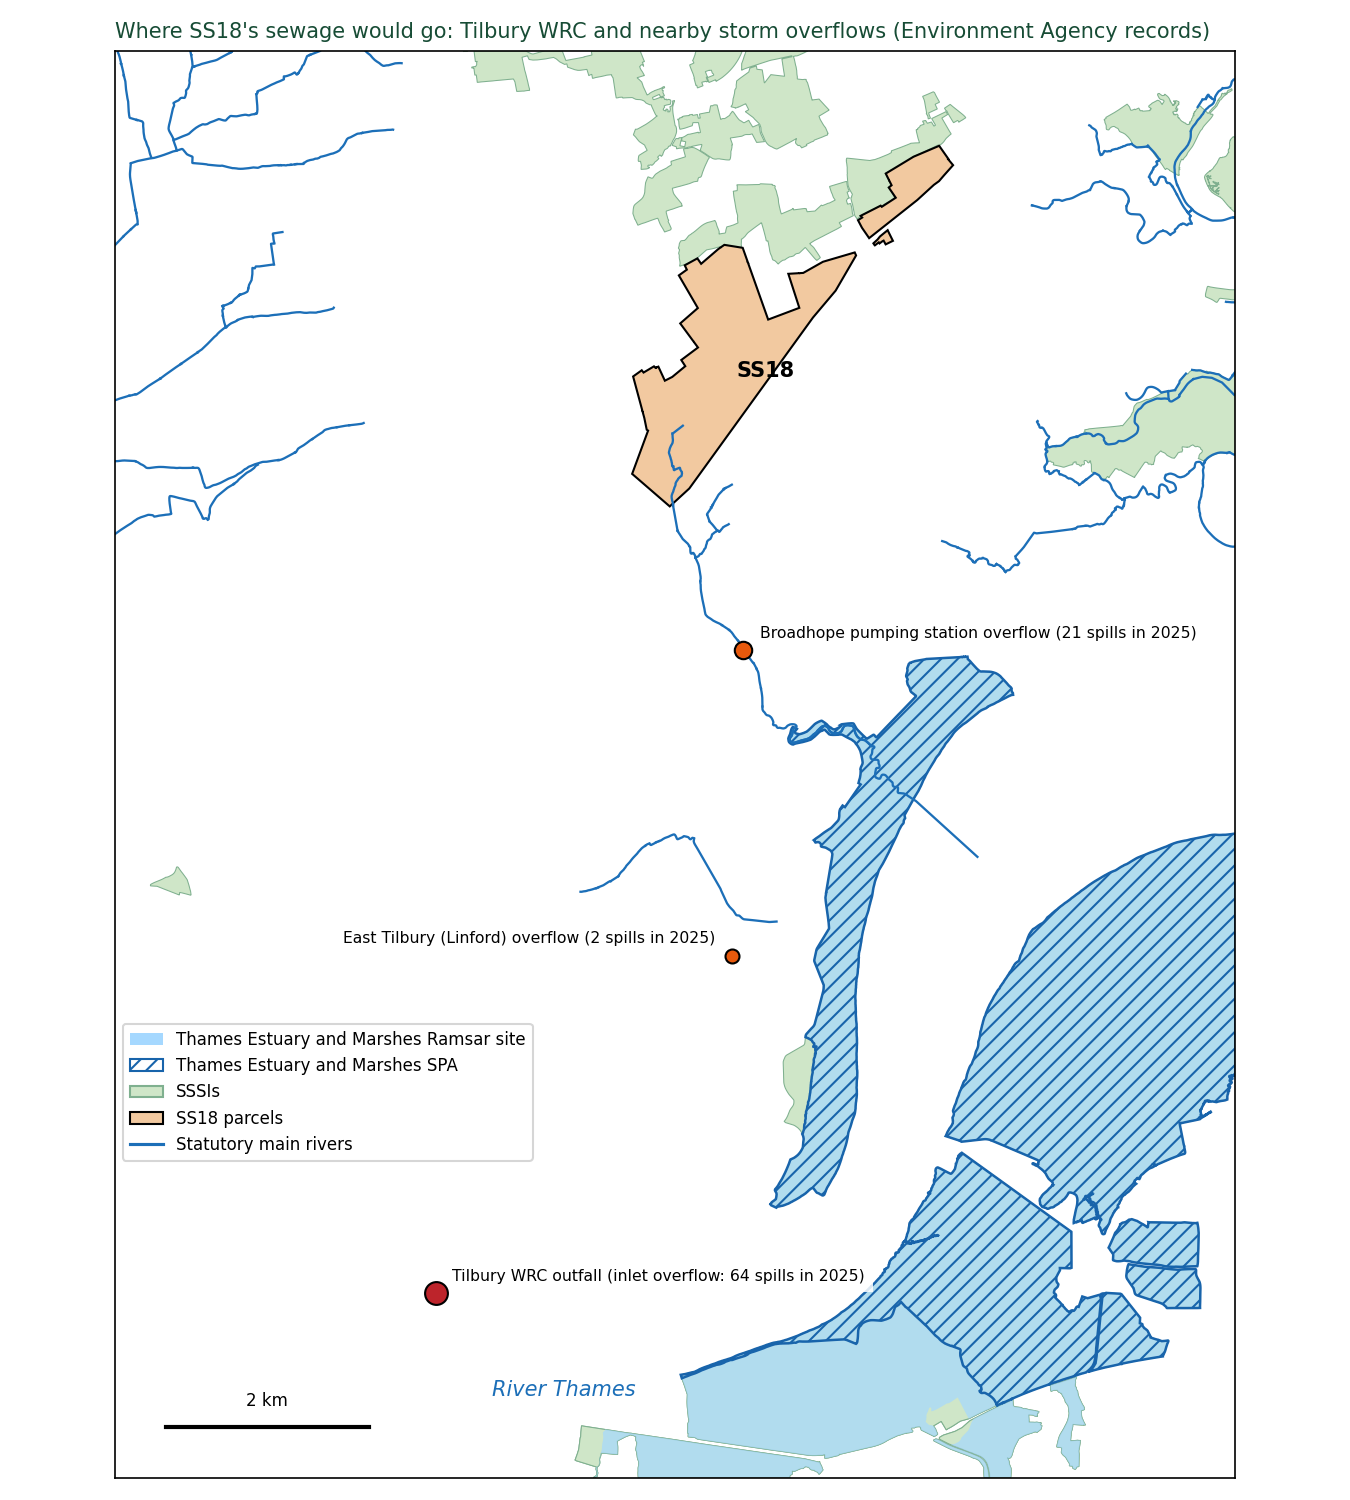
Appendix C. Information requests and responses
Table C1. The information requests made for this representation, with the reply received or the date due.
Body |
Request |
Sent |
Reference |
Due |
Status at filing |
|---|---|---|---|---|---|
Natural England |
EIR: correspondence with the Council on SS18 and the HRA |
7 Sept 2026 |
EIR2026/11807 |
5 Oct |
Answered 5 Oct (Appendix E5); consultation documents to follow |
Natural England, Chair |
Letter and two-page summary |
7 and 15 Sept |
BC2026/11997 |
none |
Procedural reply 24 Sept (Appendix E2): letters are with the officers drafting Natural England's Regulation 19 response; no position taken |
Thurrock Council |
EIR: reinstatement record, promoter demonstration, Steering Group papers, KC review scope |
10 Sept |
FOI/4949 |
8 Oct |
Acknowledged 10 Sept; no reply by the statutory deadline; chased and internal review requested 11 Oct; the Council logged the internal review on 12 Oct and gave no date for disclosure |
Environment Agency |
EIR: consultation on the allocation; Main River; SFRA sign-off |
11 Sept |
EIR2026/46894 (acknowledged 1 Oct) |
9 Oct |
Answered 9 Oct (Appendix E, item E7): no record of consultation on SS18 held; Regulation 18 response of 6 Feb 2024 and Product 4 model data released; model report, outputs and model offered under licence |
Historic England |
EIR: heritage position |
14 Sept |
26/04253 |
12 Oct |
Answered 5 Oct (Appendix E4) |
Basildon Borough Council |
EIR: cross-boundary engagement; roads; hospital |
14 Sept |
12 Oct |
No acknowledgement; chased 7 and 12 Oct |
|
NHS Mid and South Essex ICB |
Freedom of Information Act (FOIA) request: what the ICB advised on SS18 |
17 Sept |
2627284 |
13 Oct |
Acknowledged; awaiting reply; reminder 12 Oct |
East of England Ambulance Service |
FOIA: capacity; consultation |
17 Sept |
01/FOI/26/002633 (acknowledged 21 Sept) |
15 Oct |
Awaiting reply; reminder 12 Oct |
Anglian Water |
EIR: sewerage capacity |
17 Sept |
15 Oct |
Answered 12 Oct, reference 2522 (Appendix E8): no capacity check or site assessment for SS18; emails with the Council's consultants and shapefiles not supplied, requested again 12 Oct |
|
National Highways |
EIR: A13 junctions; Regulation 18 requests |
17 Sept |
#27759 |
15 Oct |
Answered 8 Oct, reference #27759 (Appendix E6): methodology agreed and forecasting report reviewed; no site-specific consultation on SS18; A13 east of the A1089 and A1014 not SRN, no trunking in RIS3 2026 to 2031; no assessment of the A13 junctions. Two documents released; the note of the 24 November meeting was not supplied (requested again 12 Oct) |
Essex County Council |
EIR: assessment of roads north of the boundary |
17 Sept |
ECC21200921 09 26 (acknowledged 21 Sept) |
15 Oct |
Awaiting reply; reminder 12 Oct |
c2c and Network Rail |
EIR/FOIA: engagement on SS18; capacity |
17 Sept |
15 Oct |
Awaiting reply; reminder 12 Oct |
|
Thurrock Council |
Supplementary EIR: promoter identity; Country Park land disposal record |
19 Sept |
related to FOI/4949 |
19 Oct |
Due after the consultation closes; any reply goes to the Inspector as a supplementary note |
Where a response has not been received by 14 October 2026 the entry records that fact. Information requested in time and not supplied before the consultation closed is itself relevant to whether the plan is based on evidence that can be examined.
Appendix D. Species recorded on and beside the allocation
Records are from my own observation and that of other residents over many years, on the SS18 land and along its boundary with Langdon Ridge SSSI, and from the statutory record. No locations are given for badger setts, bat roosts or rare plants. They are available to the Inspector on request.
Table D1. Species recorded on and beside the allocation, with their legal status and the source of the record.
Species |
Status |
Source |
|---|---|---|
Golden plover, lapwing, curlew; wintering wildfowl moving between the estuary and the fields |
Qualifying or associated species of the Thames Estuary and Marshes SPA/Ramsar; functionally linked land question (HRA 6.12, 6.17) |
Personal observation over many winters |
Skylark (good populations across both SS18 parcels), cuckoo |
Red List (Birds of Conservation Concern); section 41 |
Residents' records on the fields |
Nightingale, lesser spotted woodpecker, turtle dove, woodcock |
Red List; section 41 |
SSSI citation and Natural England condition assessments; residents' records at the boundary |
Barn owl and little owl, hunting along the SS18 boundary |
Barn owl: Schedule 1, Wildlife and Countryside Act 1981. Little owl: resident along the boundary; all wild birds protected under Part 1 of the same Act |
Residents' records |
Bats (foraging along the whole SSSI interface; roosts along the edge) |
All species protected; Habitats Regulations Schedule 2 |
Residents' records |
Badger, foraging daily from the SSSI's woodland units onto the SS18 fields |
Protection of Badgers Act 1992 |
Residents' records |
Brown hare and adder (both on the SS18 land itself), grass snake, bullfinch, grizzled skipper, brown-banded carder bee, white admiral, glow-worm |
Section 41 species of principal importance |
Residents' records; county records |
Badger foraging from Old Hill Woods (SSSI unit 22) into woodland inside the allocation; lesser spotted woodpecker nesting in woodland inside the allocation in several years, including Fell-me-down Shaw |
Protection of Badgers Act 1992; Red List, section 41 |
Personal observation over several years; badger foraging filmed. No sett or nest locations given |
Deptford pink |
Schedule 8, Wildlife and Countryside Act 1981; Endangered in England |
SSSI supporting information |
Two nationally significant invertebrate assemblages; three nationally scarce species |
SSSI notified features |
SSSI citation |
Appendix E. Replies received from Natural England, Historic England and other bodies
Replies received from public bodies to the letters listed in Appendix C, as at 13 October 2026. Full texts are held in the repository (correspondence/ and evidence/correspondence/).
E1. Natural England, Consultations Hub, 17 September 2026 (reference 558703). Confirms that the letter of 7 September has been passed to the West Anglia Area Team. States: "The onus is on the LPA [local planning authority] to decide whether a proposal is 'in or likely to affect' a SSSI, using Natural England's published Impact Risk Zones (IRZs)". The Council's Site Selection Methodology does not use them (Appendix M). On the species records supplied: "information of this nature may be relevant to the evidence base and can be submitted as part of the local plan consultation process for consideration by the Council and, where appropriate, the future Examination". They are at Appendix D. It treats light pollution as a matter for the Council rather than Natural England. [89]
E2. Natural England, John Torlesse, Deputy Director, West Anglia Area Team, on behalf of the Chair, 24 September 2026 (reference BC2026/11997). "I can confirm your letters have reached the area team and my officers, who are preparing Natural England's Regulation 19 consultation response." The area team is collating material for the information request EIR2026/11807 (due 5 October).
E3. Natural England, Ancient Woodland Inventory decision, 25 September 2026, with a map of the inclusion on 1 October 2026 (reference 485493). Fell-me-down Shaw meets the criteria for inclusion as ancient woodland. The map shows the whole wood included, at the next update of the Inventory. The application was made by a private individual.
E4. Historic England, Access to Information Officer, 5 October 2026 (reference 26/04253). Provides Historic England's Regulation 18 response of 16 February 2024 (ref. PL00794922) as "The only advice we have given the Council regarding it's [sic] emerging Local Plan and potential allocations".
On SS18: "we have not identified any record of consultation with Historic England specifically on allocation SS18 prior to its inclusion in the Regulation 19 Plan. We are not aware of having reviewed or commented on a Heritage Impact Assessment relating to the allocation."
On 5 October I sent Historic England the Heritage Impact Assessment's findings for the site and asked it to state its position on SS18 in its Regulation 19 response. [136]
E5. Natural England, Access to Information Team, 5 October 2026 (reference EIR2026/11807). Natural England holds nothing on the HRA, on any request under regulation 105(2), or on SS18 beyond its own consultation responses. No information on the Stage 2 Green Belt Assessment or the Level 2 Strategic Flood Risk Assessment. No section 28I notice or record of the Council's section 28G duty, "no records of any engagement" with the Council since 1 January 2023, including any statement of common ground. No information on birds, functionally linked land or bat roosts on the land. No condition assessment of Langdon Ridge SSSI since 2018. It welcomed the information I sent "for consideration in the submission of our own written representation". The consultation documents it holds are to follow. [137]
E6. National Highways, Spatial Planning South East, 8 October 2026 (reference #27759). Answers the three questions and the information request of 17 September.
National Highways "agreed the methodology" for the Council's transport model and "reviewed the Thurrock Strategic Model Forecasting report". It is reviewing the Transport Assessment and the Lower Langdon site assessment as a Regulation 19 consultee.
"There has been no site-specific consultation between National Highways and Thurrock Council" on SS18 at 5,000 homes with the 3,300 further homes at Corringham, Stanford-le-Hope and Horndon-on-the-Hill, and its Regulation 19 response "will not make individual reference to the sites" unless they are "of relevance to the SRN".
The A13 east of the A1089 and the A1014 are "not part of the SRN and there are no plans to adopt these sections of road in the Road Investment Strategy 3 (RIS3) period, 2026 to 2031", "the Department for Transport has not identified it as a priority and no funding allocation has been made for trunking in RIS3". "In connection with the Thurrock Local Plan, we have not carried out specific assessments of these junctions." Released with the reply: National Highways' Regulation 18 response of 19 February 2024 (11 pages), whose paragraph 6 anticipated adoption of the A13 east of the A1089 and the A1014 "within the Local Plan timeframe" and asked that the Council's modelling include that extended network, and an internal National Highways email of 16 January 2026 recording that the Lower Thames Crossing has made "no commitment" to trunk the A13/A1014 and that "A13/A1014 trunking will not happen in RIS3 as there is no funding to support it".
The note of the 24 November meeting with the Council, requested under item 1, was not supplied. [143]
E7. Environment Agency, East Anglia Area, 9 October 2026 (reference EIR2026/46894). Answers the letter and information request of 11 September.
On consultation: the Agency holds no record of any consultation with it on the SS18 allocation before its inclusion in the Regulation 19 plan (refused under regulation 12(4)(a), information not held). On flood modelling: the Flood Zones on the SS18 land are "a combination of local detailed modelling (Stanford 2016 model) and national modelling (New National model)". The Agency supplied its Product 4 data (modelled levels and flows at ten nodes on the Main River through and below the site, present day and climate change, no defences, and the site "does not benefit from any Environment Agency maintained assets") and offered the model report, outputs and model itself (Products 5 to 7, CH2M 2016) under a conditional licence. It holds no breach data.
On contamination: it is "not currently aware of any land contamination issues" for the site and there are "no historic landfills within or adjoining this site". The "Former Works" designation is a matter for the Council under Part 2A. Released with the reply: the Agency's Regulation 18 response of 6 February 2024 (reference AE/2023/129077, 32 pages), whose Lower Langdon section (page 23) says ordinary watercourses and surface water flow paths across the site "should be avoided by built development", that part of the land beside the A13 "has a high level of surface water flood risk", that development must "ensure that risk to others is not increased" in Corringham and Stanford-le-Hope downstream, and that "the new SFRA (currently in progress) should look to provide evidence base to support the consideration of this potential site", and which expected the updated SFRA "to inform the allocation of land" (pages 2 to 3). [148]
E8. Anglian Water, EIR team, 12 October 2026 (reference 2522). Answers the three questions and the information request of 17 September.
On consultation: Anglian Water "has engaged in the preparation of the Local Plan and provided information to consultants preparing the Water Cycle Study". Its last formal consultation response was in February 2024, on the Water Cycle Study, when it commented on Lower Langdon as a "New Place Opportunity Area". It has exchanged emails and data with the consultants preparing a detailed Water Cycle Study, and attended two online meetings with the Council and its consultants to discuss that study "in general terms", of which "there are no available meeting notes". The detailed study "does not appear to be published at the current time". Anglian Water will respond to the Regulation 19 consultation by 14 October and is "unable to indicate whether we will find policies unsound".
On capacity: SS18's foul flows would go to Tilbury Water Recycling Centre. Anglian Water reports headroom at the works against its dry weather flow permit, measured before sites with planning consent that have yet to connect. It gives no figure for the sewer network, and has made no capacity check, pre-development enquiry or connection assessment for the SS18 land: its answer to the request for any such assessment is to refer back to its consultation responses. Developers are "encouraged to engage with Anglian Water at an early stage and submit a pre-planning enquiry", and a point of connection is identified by a "complexity matrix" that weighs "pollution risks and storm overflow spills, surcharges of our network, existing flood potential and excess surface water flooding".
On infrastructure and funding: no SS18 scheme is identified in the Drainage and Wastewater Management Plan of 2023; growth at water recycling centres is funded through the price review, and "developers promoting residential sites are unable to directly fund growth schemes at our water recycling centres".
Withheld: the emails with the Council's consultants about the SS18 land, described but not supplied, and shapefiles, on the ground that they "require specialised software to open". No exception under the Regulations was cited. A follow-up asking for both was sent on 12 October.
Awaited: Essex County Council, information request lodged with its information rights team after an automatic reply (15 October), NHS Essex Integrated Care Board (13 October), East of England Ambulance Service (15 October), Historic England's Regulation 19 response, Basildon Borough Council, Natural England's Regulation 19 response, and the consultation documents Natural England said would follow its information request response. National Highways' note of its 24 November meeting with the Council, requested and not supplied.
Volume 2: Supporting schedules and analyses
This volume holds Appendix F (the schedule of 162 defects, each with the test it fails and its source) and Appendices G to Q (the independent analyses made for this representation, each with its question, data, method, results and limits).
The representation itself, with its summaries, grounds, modifications and Appendices A, B, C, D and E, is Volume 1. In the filed copy the two volumes are separate documents. Here they follow one another.
Appendix F. Schedule of defects: all 162, each with the test it fails and its source
Every defect identified in this representation's examination of the Council's evidence, grouped by tier and in order of severity. Each item gives a short title and what is wrong; Fails, the soundness test or legal requirement it engages; Source, the document (with its number in Appendix A) and the PDF page on which the point can be checked; and its consequence at Examination and for the five-year housing land supply. PDF page numbers are the page of the PDF file as published, which can differ from the number printed on the page. Where the source is one of the independent analyses made for this representation, the item names the repository note and the appendix of this representation that sets out its method and full results.
Classifications: FATAL UNLESS CURED (a legal defect curable only by a consulted addendum); SITE OUT (the Inspector removes the allocation by main modification); MOD (curable by rewording or new evidence); SUPPORT (adds weight); APPLICATION (bites after adoption on any application).
Five-year supply: BAR UP (raises the requirement the Council is judged against); NIL (SS18 contributes nothing); APPEAL ON SITE; APPEAL BOROUGH; N/A.
Tier 10 items are plan-wide and recorded as context for the pattern SS18 exemplifies; they are not grounds of this representation.
Tier 1. Legal compliance
Test engaged: Legal compliance. Developed at section 3.
F1. The habitats assessment does not assess SS18. The HRA does not mention SS18, Lower Langdon, Corringham Park Farm or land north of the A13.
Fails: legal compliance.
Source: Habitats Regulations Assessment (LUC, July 2026) [11]: full text search, no occurrence of "Langdon", "Corringham Park" or "north of the A13"; its "Policy SS18" entry is West Horndon, PDF page 285.
Examination: FATAL UNLESS CURED. Five-year supply: NIL.
F2. The habitats assessment was not consulted with Natural England. The HRA was never consulted with Natural England, although it says itself it should be.
Fails: legal compliance.
Source: Habitats Regulations Assessment [11], PDF pages 8 and 133 (consultation with Natural England); no published record of the consultation.
Examination: FATAL UNLESS CURED. Five-year supply: N/A.
F3. No conclusion of no adverse effect for any allocation. The HRA cannot conclude no adverse effect on the Thames Estuary sites for any allocation; the Lower Thames Crossing traffic data does not exist.
Fails: legal compliance.
Source: Habitats Regulations Assessment [11], executive summary, PDF page 8 ("Until such time as ... the AADT traffic modelling data is provided, a conclusion of no adverse effect on integrity cannot be reached").
Examination: FATAL UNLESS CURED, plan-wide. Five-year supply: N/A.
F4. The habitats assessment was written to a different plan. The HRA is written to a different policy numbering and relies on a policy that does not exist.
Fails: legal compliance.
Source: Habitats Regulations Assessment [11], PDF pages 7 to 8 ("DM28", "Parts 1 and 2") and 270 ("SS14 Land north-east of South Ockendon"); Integrated Impact Assessment [8], summary matrix, PDF page 499.
Examination: SUPPORT (shows haste). Five-year supply: N/A.
F5. The SANG the SSSI depends on is not in the habitats assessment. The SANG the SSSI protection depends on is not in the HRA and has no area, location, cost or delivery body.
Fails: legal compliance; effective.
Source: Regulation 19 Local Plan [1], Policy SS18, PDF pages 288 and 292 to 293 (SANG required); Habitats Regulations Assessment [11]: "SANG" and "Suitable Alternative Natural Greenspace" occur 0 times; IDP Schedule Part 2 [31].
Examination: SITE OUT. Five-year supply: APPEAL ON SITE (no mitigation to condition).
F6. The adopted strategy was never appraised. The appraisal never scored the adopted strategy; the only option with Lower Langdon scored worse than the option without it on eight objectives.
Fails: legal compliance; justified.
Source: Integrated Impact Assessment [8], Table 2.2, PDF page 53; paragraph 2.55 ("one new town") and 2.68, PDF pages 49 and 55; paragraphs 4.73 to 4.80, PDF pages 136 to 143 (HG1 scores better than HG2).
Examination: FATAL UNLESS CURED; the cure produces evidence for deletion. Five-year supply: N/A.
F7. No statement of common ground with anyone. No statement of common ground with any council, provider or statutory body.
Fails: legal compliance; effective.
Source: The Council's published evidence base (no statement of common ground listed); Statement of Community Involvement [53], page 10; Regulation 19 Local Plan [1], tests of soundness, PDF page 13.
Examination: MOD (the statutory duty to cooperate ceased to apply on 25 March 2026 and was not saved for legacy plans; the Cabinet report's statement at 4.31 that it has no legal status is correct. What remains is the NPPF policy test of "maintaining effective co-operation", a soundness matter the Inspector can require to be evidenced by statements of common ground before or during the Examination). Five-year supply: N/A.
F8. Neighbours' objections unresolved. Basildon's Regulation 18 objection to Lower Langdon and Brentwood's to West Horndon are unresolved.
Fails: legal compliance; effective.
Source: Regulation 18 Consultation Statement [7], Basildon Borough Council comment IP0024, PDF page 90, and Essex County Council comment IP0104, PDF page 113.
Examination: MOD (unresolved cross-boundary objections go to soundness under NPPF paragraphs 24 to 27; removing SS18 resolves Basildon's). Five-year supply: N/A.
F9. Never proposed at Regulation 18. The site was never proposed at Regulation 18; the Council said it lacked the information; Corringham Park Farm was never shown.
Fails: positively prepared.
Source: Local Plan Initial Proposals (December 2023) [48], PDF page 154 ("At this stage we do not have enough information"); Corringham Park Farm not shown.
Examination: SUPPORT (Inspectors generally treat Regulation 19 as the public's opportunity; the Council's own admission is a soundness point). Five-year supply: N/A.
F10. No in-combination assessment with the Lower Thames Crossing. The in-combination assessment with the Lower Thames Crossing has not been done.
Fails: legal compliance.
Source: Habitats Regulations Assessment [11], executive summary, PDF page 8 (air pollution in combination with the Lower Thames Crossing unresolved).
Examination: FATAL UNLESS CURED. Five-year supply: N/A.
F11. The water-quality assessment relies on the wrong water company. The HRA's water-quality appropriate assessment for the Thames Estuary and Marshes SPA and Ramsar site concludes no adverse effect "providing that the mitigation measures and improvements set out by Southern Water are followed" (PDF page 125): Kent's sewerage undertaker, Medway, Motney Hill, Gravesend, Canterbury, Sandwich. Thurrock's undertaker is Anglian Water; "Anglian" occurs 0 times in the HRA and Tilbury WRC is never named. No mitigation exists for the pathway the HRA itself identified (6.79). Plan-wide; independent of F1.
Fails: legal compliance.
Source: Habitats Regulations Assessment [11], paragraphs 6.77 to 6.81, PDF pages 122 to 125; Water Cycle Study Scoping Report [43], sections 5.4 and 5.4.1, PDF pages 22 to 23; report/WATER-AND-SEWERAGE-NOTE-2026-09-23.md.
Examination: FATAL UNLESS CURED. Five-year supply: NIL.
F12. Tilbury works already overflowing. The works the HRA omits is already failing on the pathway it names: Tilbury WRC's inlet storm overflow spilled 44 (April to December 2023), 56 (2024) and 64 (2025) times, Anglian Water's reason "Hydraulic capacity", "No improvement action in reporting period"; permit sets no nitrogen or phosphorus limit; outfall 2.1 km from the Ramsar site. Published March 2026, four months before the HRA.
Fails: legal compliance; effective.
Source: Environment Agency storm overflow annual returns 2023 to 2025 [115]; Tilbury WRC permit [114]; report/TILBURY-PERMIT-AND-OVERFLOWS-NOTE-2026-09-23.md (Appendix K).
Examination: FATAL UNLESS CURED (with F11). Five-year supply: N/A.
Tier 2. The Council's own consultants against the site
Test engaged: Justified. Developed at sections 4.1 to 4.4.
F13. The Green Belt study rejected the land. Green Belt: "Not recommended for further consideration"; 5 of 5 for preventing towns merging; "would lead to the physical merging of neighbouring towns" (Corringham and Stanford-le-Hope with Basildon).
Fails: justified; consistent with national policy.
Source: Stage 2 Green Belt Assessment, Appendix 4.5 (Arup, February 2026) [13], sub-area CS-01, PDF pages 4 to 6.
Examination: SITE OUT. Five-year supply: N/A.
F14. No defensible new Green Belt boundary. Green Belt: no defensible boundary; the new boundary "would not meet the NPPF definition".
Fails: justified; consistent with national policy.
Source: Stage 2 Green Belt Assessment, Appendix 4.5 [13], sub-area CS-01, PDF page 6.
Examination: SITE OUT. Five-year supply: N/A.
F15. Not grey belt. Green Belt: "Provisional Grey Belt: No"; the plan's exceptional circumstances case rests on grey belt parcels and calls itself "emerging".
Fails: justified; consistent with national policy.
Source: Stage 2 Green Belt Assessment, Appendix 4.5 [13], sub-area CS-01, PDF page 6 ("Provisional Grey Belt: No"); Regulation 19 Local Plan [1], paragraph 6.8.3, PDF page 361 (grey belt case described as "emerging").
Examination: SITE OUT. Five-year supply: APPEAL BOROUGH (grey belt elsewhere comes forward by application anyway).
F16. No reasons for overruling the consultant. No reasons recorded for overriding the consultant, here or on six other allocations.
Fails: justified; consistent with national policy.
Source: Regulation 19 Local Plan [1], Policy SS18 and supporting text, PDF pages 288 to 296; Stage 2 Green Belt Assessment appendices [13] [44] [45] [46]; the re-score made for this representation, report/SITE-SELECTION-RESCORE-NOTE-2026-09-23.md.
Examination: SITE OUT here; MOD elsewhere. Five-year supply: N/A.
F17. Weakest Green Belt taken while capacity existed elsewhere. Third-tier "other Green Belt" taken with 50,128 homes of assessed capacity available.
Fails: justified; consistent with national policy.
Source: Housing Land Availability Assessment, main report (October 2025) [38], PDF page 7 (50,128 dwellings of capacity).
Examination: SITE OUT (release sequence). Five-year supply: N/A.
F18. Corringham Park Farm "Unsuitable" ten months before allocation. Housing land study: Corringham Park Farm "Unsuitable" ten months before allocation as the first phase.
Fails: justified.
Source: Housing Land Availability Assessment Appendices 2 to 4 (October 2025) [15], Appendix 3, site 60893, PDF page 7.
Examination: SITE OUT (both parcels: no first phase, no phasing). Five-year supply: NIL.
F19. Standalone settlements needed further assessment that was never done. Housing land study: standalone settlements need "further detailed assessments"; none done beyond a capacity study instructed to hit a number.
Fails: justified.
Source: Housing Land Availability Assessment, main report [38], PDF page 6 ("further detailed assessment").
Examination: SITE OUT. Five-year supply: NIL.
F20. The Council's own viability study: negative land value. Viability: residual land value minus £9.8 million and minus £0.9 million; unviable at the plan's own affordable housing requirement.
Fails: effective; justified.
Source: Local Plan and CIL Viability Assessment (AspinallVerdi, June 2026) [29], Table 8.2, PDF pages 168 to 169.
Examination: SITE OUT (North Essex 2020 ground). Five-year supply: NIL; APPEAL ON SITE (viability route cuts affordable housing and infrastructure).
F21. Undeliverable in years one to five; discussions stalled. Viability: undeliverable in years one to five; promoter returned no figures; discussions "stalled".
Fails: effective.
Source: Viability Assessment [29], paragraphs 8.63 to 8.68, PDF page 166.
Examination: SITE OUT. Five-year supply: NIL.
F22. Heritage harm the Council says to avoid. Heritage: "Moderate Adverse ... should be avoided"; Horndon Conservation Area, Grade I church, four listed buildings, Arden Hall. Historic England was never consulted on SS18 and has not seen this assessment [136].
Fails: justified; consistent with national policy.
Source: Heritage Impact Assessment, Housing Sites (February 2026) [36], row for site 60940, PDF page 5; Historic England EIR reply 26/04253, 5 October 2026 [136].
Examination: SITE OUT contribution. Five-year supply: N/A.
F23. Landscape of "very high" susceptibility. Landscape: "Very high" susceptibility; not cited in the policy.
Fails: justified; consistent with national policy.
Source: Landscape Sensitivity and Capacity Analysis (May 2026) [16], Table 48, Character Area J1 Langdon Lower Hill Slopes, PDF page 113.
Examination: SUPPORT. Five-year supply: N/A.
F24. The capacity study was told the answer. Capacity study instructed to "demonstrate capacity exceeding the 4,000-dwelling target"; assumed developable "having been identified by TC"; 4,041 result.
Fails: justified.
Source: Transport Assessment: Lower Langdon Site Specific Assessment (Arup, July 2026) [14], PDF pages 22 ("having been identified by TC") and 24 ("must demonstrate capacity exceeding the 4,000-dwelling target").
Examination: SITE OUT (not justified). Five-year supply: NIL.
F25. Corringham Park Farm: 463 at best practice, not 1,000. Corringham Park Farm's best-practice capacity is 463, not 1,000; 1,000 "falls below best-practice standards".
Fails: justified; effective.
Source: Lower Langdon Site Specific Assessment [14], section 5.4.2 and Tables 5-4 and 5-5, PDF page 25.
Examination: SITE OUT for the parcel. Five-year supply: NIL.
F26. The land budget does not close. The land budget does not close: employment and schools in a 6.4 ha allowance; open space 14 ha short; no Traveller land; no SANG land.
Fails: effective; justified.
Source: Lower Langdon Site Specific Assessment [14], Table 5-2, PDF page 24; Regulation 19 Local Plan [1], Policy SS18, PDF pages 291 to 293.
Examination: SITE OUT (not effective). Five-year supply: APPEAL ON SITE (a developer builds what fits and negotiates away the rest).
F27. The constraints map found "no other protected areas". The constraints map found "no other protected areas" on a site bounded by a SSSI with two Local Wildlife Sites inside it.
Fails: justified.
Source: Lower Langdon Site Specific Assessment [14], PDF page 17.
Examination: SUPPORT (capacity overstated). Five-year supply: N/A.
F28. The 2023 appraisal: the land keeps the towns apart. The 2023 appraisal scored the land significant negative on soils, resources, water, flood and landscape and said it "prevents Stanford le Hope and Langdon from merging".
Fails: justified.
Source: Integrated Impact Assessment Appendices (July 2026) [9], paragraphs G.299 to G.302, PDF page 439; 2023 IIA Appendices [54], PDF page 493.
Examination: SITE OUT contribution. Five-year supply: N/A.
F29. The two-town strategy ranked fifth of six. The 2023 appraisal ranked the two-new-towns strategy fifth of six; the Council chose distributed growth as "the most sustainable option".
Fails: justified.
Source: Integrated Impact Assessment of the Initial Proposals (LUC, November 2023) [50], paragraphs 4.90 to 4.91, PDF page 158.
Examination: FATAL UNLESS CURED (alternatives). Five-year supply: N/A.
F30. Dropped, then reinstated on an unpublished claim. The 2026 preferred strategy "did not take forward Lower Langdon"; reinstated "because of the increased housing requirement" on an unpublished promoter demonstration.
Fails: justified.
Source: Integrated Impact Assessment [8], paragraph 2.61, PDF page 51.
Examination: SITE OUT (not justified). Five-year supply: BAR UP (the raised requirement is the reason the site exists).
F31. Lower Langdon adds no homes in the option table. The option table gives the towns identical homes with or without Lower Langdon; it only replaces 5,000 at West Horndon.
Fails: justified.
Source: Integrated Impact Assessment [8], Table 2.2, PDF page 53; paragraph 2.64, PDF page 52.
Examination: SUPPORT (removal costs nothing). Five-year supply: N/A.
F32. "Submitted speculatively, no assessments have been done". The 2022 charrette: "submitted speculatively, no assessments have been done".
Fails: justified.
Source: Horndon on the Hill Stakeholder Charrettes (2022) [62], PDF page 44.
Examination: SUPPORT. Five-year supply: N/A.
F33. "Plan B". The Council's own label for the strategy with SS18 is "Plan B".
Fails: justified.
Source: Cabinet report, 26 August 2026 [4], PDF pages 4, 6 and 9; Local Plan Transport Assessment [32] scenario "2044 Plan B".
Examination: SUPPORT (lead for EIR). Five-year supply: N/A.
F34. The only allocation that fails every constraint. Re-scored on the Council's own consultants' findings, SS18 is the only one of nine strategic allocations that fails every constraint column (Green Belt, grey belt, heritage, Flood Zone 3, future flood extent, Main River, sequential rank).
Fails: justified.
Source: The re-score made for this representation on the Council's own consultants' findings: report/SITE-SELECTION-RESCORE-NOTE-2026-09-23.md (Appendix M); sources in that note.
Examination: SITE OUT contribution. Five-year supply: N/A.
F35. More Green Belt released against advice than the advice allowed. The plan releases about 848 hectares of Green Belt its consultant recommended against, more than the 816 hectares the consultant said could be considered; SS18 is 250 hectares, 2.1 per cent of the borough's Green Belt, the largest recommended-against block that is not grey belt. No reasons recorded for any departure.
Fails: justified; consistent with national policy.
Source: Stage 2 Green Belt Assessment and appendices [12] [13] [44] [45] [46]; report/SITE-SELECTION-RESCORE-NOTE-2026-09-23.md (Appendix M).
Examination: SITE OUT contribution; MOD plan-wide. Five-year supply: N/A.
F36. The Council's own refusals for harm to openness. Twenty Green Belt refusals on and around the allocation, continuous from 2012 to January 2026, for extensions, outbuildings, caravans and single dwellings, each for harm to openness; 168 refusals since 1948. The allocation records no reason why that harm no longer applies.
Fails: justified; consistent with national policy.
Source: Thurrock online planning register [122]; report/PLANNING-HISTORY-NOTE-2026-09-23.md (Appendix L).
Examination: SUPPORT. Five-year supply: N/A.
Tier 3. Ecology and protected sites
Test engaged: Justified; consistent with national policy. Developed at sections 3.4, 4.6 and 6.2.
F37. No ecological survey of any kind. No ecological survey of any kind: habitat, protected species, birds, bats, newts, reptiles, badger, invertebrates, plants, trees, hedgerows.
Fails: justified; consistent with national policy.
Source: The Council's published evidence base (no ecological survey listed); Integrated Impact Assessment Appendices [9], Appendix D, PDF page 209.
Examination: SITE OUT (justified) for a site abutting a SSSI. Five-year supply: APPEAL ON SITE (surveys at application stage will find what the plan ignored; Schedule 1 and section 41 species delay or block).
F38. Biodiversity impacts "cannot be determined". The appraisal admits biodiversity impacts "cannot be determined at this strategic level"; the policy defers survey to the masterplan.
Fails: justified; consistent with national policy.
Source: Integrated Impact Assessment Appendices [9], Appendix D, PDF page 209; Regulation 19 Local Plan [1], Policy SS18, PDF page 293 (survey deferred to masterplan).
Examination: SITE OUT contribution. Five-year supply: N/A.
F39. Inside Natural England's Impact Risk Zone, touching the SSSI. The allocation is inside Natural England's Impact Risk Zone, touches SSSI unit 22, and the SSSI extends into its northern part.
Fails: justified; consistent with national policy.
Source: Natural England Impact Risk Zones and SSSI unit boundaries [87] [90]; Site Selection Methodology (July 2026) [37], section 3.2.1 and Table 2, PDF page 9; Regulation 19 Local Plan [1], PDF pages 288 and 295.
Examination: SITE OUT. Five-year supply: APPLICATION (Natural England consulted on every application; N6 refusal default).
F40. Natural England's 2024 advice unanswered. Natural England advised in February 2024 (IP0179) that the site should not go forward until alternatives were fully considered; unanswered.
Fails: justified; consistent with national policy.
Source: Regulation 18 Consultation Statement [7], Natural England comment IP0179 and the Council's response, PDF pages 67 and 134.
Examination: FATAL UNLESS CURED (its Regulation 19 response can be decisive). Five-year supply: N/A.
F41. Visitor pressure already recorded on the SSSI. Recreational disturbance recorded by Natural England as an active pressure on the SSSI since 2019; 12,000 people added with no visitor, carrying-capacity or trampling assessment.
Fails: justified; consistent with national policy.
Source: Natural England, Designated Sites View, Langdon Ridge SSSI S2000857, site pressures [88] ("Recreational Disturbance", since 12 September 2019).
Examination: SITE OUT. Five-year supply: N/A.
F42. The SSSI is still recovering. The SSSI is 80.5 per cent "unfavourable recovering".
Fails: justified; consistent with national policy.
Source: Natural England, Designated Sites View, Langdon Ridge SSSI, unit condition summary [88] (80.5 per cent "unfavourable recovering").
Examination: SUPPORT. Five-year supply: N/A.
F43. Red List birds. Red List in the SSSI record: lesser spotted woodpecker, nightingale, turtle dove, woodcock. On the fields: cuckoo, skylark.
Fails: justified; consistent with national policy.
Source: Natural England, Langdon Ridge SSSI supporting information [23]; Protect Langdon field records (Appendix D).
Examination: SUPPORT (justified; NPPF 187). Five-year supply: APPEAL ON SITE (skylark and cuckoo on the arable are application-stage constraints).
F44. Species of principal importance. Section 41 species: the four above plus cuckoo, skylark, bullfinch, brown hare, adder, grizzled skipper, brown-banded carder bee, white admiral; barn owl (Schedule 1); badger; Deptford pink (Schedule 8); glow-worm.
Fails: justified; consistent with national policy.
Source: Natural England, Langdon Ridge SSSI citation and supporting information [21] [23]; Local Wildlife Sites Register [18]; county and residents' records (Appendix D).
Examination: SUPPORT. Five-year supply: APPLICATION (licensing, seasonal survey delays).
F45. Notified invertebrate assemblages; no invertebrate survey. The SSSI's notified invertebrate assemblages and three nationally scarce species; no field invertebrate survey.
Fails: justified; consistent with national policy.
Source: Natural England, Langdon Ridge SSSI citation [21] and supporting information [23].
Examination: SUPPORT. Five-year supply: N/A.
F46. The fields are the linkage. "Archipelago of sites" dependent on "linkage and the avoidance of isolation"; the fields are the linkage.
Fails: justified; consistent with national policy.
Source: Natural England, Langdon Ridge SSSI supporting information [23] ("archipelago of sites"; "linkage and the avoidance of isolation").
Examination: SITE OUT contribution (section 28G). Five-year supply: N/A.
F47. Functionally linked land for the estuary unassessed. Functionally linked land for the estuary SPA (wintering waterbirds) unassessed on this site.
Fails: legal compliance; justified.
Source: Habitats Regulations Assessment [11], section 6.17, PDF page 95; NECR207 [71]; Protect Langdon wintering bird records (Appendix D).
Examination: FATAL UNLESS CURED (HRA). Five-year supply: N/A.
F48. Two Local Wildlife Sites inside the allocation. Two Local Wildlife Sites inside the allocation, ignored by the design.
Fails: justified; consistent with national policy.
Source: Local Wildlife Sites Register 2022 [18], Th56 Fell-me-down Shaw (PDF page 78) and Th90 Lodge Hall Shaw (PDF page 123); Natural England ancient woodland decision on Fell-me-down Shaw, 25 September and 1 October 2026 (reference 485493).
Examination: SUPPORT. Five-year supply: APPLICATION.
F49. A Local Nature Reserve named and then forgotten. Grove House Wood Local Nature Reserve named as a receptor in the appraisal and absent from the policy, the HRA and the constraints work.
Fails: justified; consistent with national policy.
Source: Integrated Impact Assessment [8], paragraph 4.80, PDF page 143; Habitats Regulations Assessment [11] and Policy SS18 [1] (not mentioned).
Examination: SUPPORT. Five-year supply: N/A.
F50. No noise, light or air assessment. No noise, light or air assessment for the SSSI's bats, owls and invertebrates, or for existing residents. The Government's own noise maps put 59 per cent of the allocation, and all of Corringham Park Farm, above the WHO limits for road traffic noise by day and night; no barrier or buffer land is provided (Appendix Q). The two estates the Council recently approved beside the A13 at Stanford-le-Hope each had a site noise assessment and a noise condition before approval, and officers recorded their noisy gardens as harm [135]; SS18 has neither.
Fails: justified; consistent with national policy.
Source: The Council's published evidence base (no such assessment listed); Integrated Impact Assessment [8], paragraph 6.426; Defra strategic noise maps, Round 4 [134]; report/NOISE-A13-DEFRA-ROUND4-NOTE-2026-10-04.md (Appendix Q).
Examination: SUPPORT. Five-year supply: APPLICATION.
F51. Biodiversity net gain at the minimum, with no baseline. Biodiversity net gain at 10 per cent where county evidence supports 20; no baseline; 4 per cent of the site.
Fails: justified; consistent with national policy.
Source: Regulation 19 Local Plan [1], Policy DMP24, PDF pages 331 to 332; Lower Langdon Site Specific Assessment [14], Table 5-2, PDF page 24 (4 per cent biodiversity land).
Examination: MOD. Five-year supply: APPLICATION.
F52. The Council's wildlife plan is out of date. The Council's Biodiversity Action Plan is "currently out of date"; its Greengrid strategy names species using these fields.
Fails: justified; consistent with national policy.
Source: Integrated Impact Assessment Appendices [9], PDF page 158 ("currently out of date").
Examination: SUPPORT. Five-year supply: N/A.
F53. A road link drawn through ancient woodland in the SSSI. The £3 million "Laindon Road" connection is drawn through ancient woodland inside the SSSI.
Fails: justified; consistent with national policy; effective.
Source: IDP Schedule Part 2, Lower Langdon [31], PDF page 1 (Laindon Road link); Natural England Ancient Woodland Inventory [90]; Site Selection Methodology [37] (ancient woodland an absolute constraint).
Examination: SITE OUT contribution (not effective). Five-year supply: APPLICATION (N6(2): "should be refused").
F54. Capacity re-derived with the missing constraints. Capacity re-derived on the Council's own figures, deducting only land the capacity study did not already leave out: 3,841 homes on the Council's own capacity, falling to 2,861 once the drainage land its own policy needs and 50 m buffers to the SSSI and the two shaws are set aside, 2,734 with an A13 noise bund and fence (Appendix Q), and 2,126 if SANG is also provided to Natural England's standard (Appendix I), against 5,000. Parcel b shares 1,075 m of boundary with the SSSI; 91 per cent of it lies within 250 m.
Fails: justified; effective.
Source: HLAA [15], PDF page 37 (3,378); Lower Langdon Site Specific Assessment [14], Tables 5-1 and 5-5, PDF pages 22 and 25; tools/stepdown_2026_10_01.py and evidence/data/ss18-stepdown-2026-10-01.json (Appendix I).
Examination: SITE OUT contribution (capacity not demonstrated). Five-year supply: NIL.
F55. The site scoring ignored the SSSI. The site scoring counts an SSSI only where land lies inside it and does not use Natural England's Impact Risk Zones; Lower Langdon's 68.75 is a flood score, and the SSSI cost it nothing.
Fails: justified.
Source: Site Selection Methodology [37], section 3.2.1 and Table 2, PDF page 9; Natural England Impact Risk Zones user guidance [87]; report/BALANCE-SCORE-NOTE-2026-09-25.md.
Examination: SITE OUT contribution (justified). Five-year supply: N/A.
F56. The only site assessment barely shows the SSSI. The only site assessment's constraints map barely shows the SSSI (unit 22 coloured as ancient woodland and priority habitat), mentions SSSIs once, in its list of data, and never names Langdon Ridge, and applies no setback from it.
Fails: justified.
Source: Lower Langdon Site Specific Assessment [14], Figure 3-1, PDF page 17, and Table 5-1, PDF page 22; report/FILE-NOTE-2026-09-25-ARUP-FIG-3-1-SSSI.md.
Examination: SUPPORT. Five-year supply: N/A.
F57. The parcel with the longest SSSI edge left out of the constraints work. Corringham Park Farm, the parcel with the longest SSSI boundary, is left out of the site assessment's constraints analysis but treated as 88 per cent developable.
Fails: justified.
Source: Lower Langdon Site Specific Assessment [14], PDF page 17 ("constraints analysis focuses on the Lower Langdon housing site only") and Table 5-5, PDF page 25.
Examination: SITE OUT contribution. Five-year supply: N/A.
F58. The only layout routes people into the SSSI. The policy requires a SANG to reduce pressure on the SSSI; the only layout shows no SANG and routes "Biodiversity Corridor / Active Travel Route" arrows into the SSSI woods, built in the first phase.
Fails: justified; effective.
Source: Lower Langdon Site Specific Assessment [14], Figure 5-8, PDF pages 27 to 28 ("Biodiversity Corridor / Active Travel Route"), and Figure 5-12; Regulation 19 Local Plan [1], Policy SS18, PDF pages 292 to 293.
Examination: SITE OUT contribution (justified, effective). Five-year supply: APPLICATION.
F59. Priority grassland inside the allocation not named. Hawksbury Grasslands, 9 hectares of MG5 priority grassland (the SSSI's notified "nationally rare" type) inside Parcel b, is not named in the policy.
Fails: justified; consistent with national policy.
Source: Local Wildlife Sites Register 2022 [18], Th66 Hawksbury Grasslands, PDF page 84; Langdon Ridge SSSI supporting information [23], section 2.1.
Examination: SUPPORT. Five-year supply: APPLICATION.
F60. The "green-blue network" is mostly what is there already. The "green-blue network" is mostly existing hedgerow, shaws, watercourse and roadside trees; new habitat is 4 per cent of Parcel a's developable land and 2 per cent of Parcel b's.
Fails: justified; consistent with national policy.
Source: Lower Langdon Site Specific Assessment [14], Tables 5-2 and 5-4, PDF pages 24 to 25.
Examination: SUPPORT. Five-year supply: N/A.
F61. A setback does not answer harm from size. A setback from the SSSI boundary would not address harm arising from the settlement's size and pathways; the Thames Basin Heaths framework applies avoidance to 5 kilometres.
Fails: justified; consistent with national policy.
Source: Thames Basin Heaths SPA Delivery Framework (2009) [130]; Natural England Impact Risk Zones [87].
Examination: SITE OUT contribution. Five-year supply: N/A.
Tier 4. Flood, water and ground
Test engaged: Justified; consistent with national policy. Developed at sections 4.6 and 6.3.
F62. The flood study is an unapproved draft. The Level 2 flood assessment is "NOT YET APPROVED FOR ISSUE", cites a superseded plan period and "Section X"; site appendices unpublished.
Fails: justified; consistent with national policy.
Source: Level 2 Strategic Flood Risk Assessment (AECOM, February 2026, draft) [34], quality page, PDF page 2 ("WORKING DOCUMENT / NOT YET APPROVED FOR ISSUE"), and PDF page 5 ("Section X").
Examination: MOD plan-wide; SITE OUT contribution here. Five-year supply: N/A.
F63. Functional floodplain on site; no model. Flood Zone 3b on site "should be retained as floodplain"; modelling "should be undertaken"; none has. The Environment Agency's own Flood Map (May 2026) puts about 24 hectares of the site, 10.7 per cent, in Flood Zone 3 and a further 5.3 per cent in Zone 2. The capacity study leaves both out of its developable area, with setbacks; what is missing is the model, so neither the functional floodplain's true extent nor the surface water risk on the land the study does build on has been tested (Appendix O).
Fails: justified; consistent with national policy.
Source: Level 2 Strategic Flood Risk Assessment [34], site table, entry ACM_071 (site 60940), PDF page 14; Environment Agency Flood Map for Planning, May 2026 [91]; Lower Langdon Site Specific Assessment [14], Table 5-1, PDF page 22.
Examination: SITE OUT (NPPF prohibits housing on functional floodplain; capacity not justified). Five-year supply: APPEAL ON SITE (a model at application shrinks the site and the numbers).
F64. A Main River through the site. About one kilometre of statutory Main River (Horndon Brook) runs through the site to the A13; the Agency is the responsible authority and was not consulted on the allocation so far as any published record shows.
Fails: justified; consistent with national policy.
Source: Regulation 19 Local Plan [1], PDF page 289 (Horndon Brook); Environment Agency Statutory Main River Map [91].
Examination: SUPPORT (brings the Agency into the Examination as a party with a duty). Five-year supply: N/A.
F65. Two documents disagree on flooding. The sequential test records Flood Zone 3b on 225 hectares and carries the site through anyway; the appraisal (IIA Appendices, paragraph G.299) says the land "is not within Flood Zones 2 or 3". The Agency's map says 16 per cent of it is.
Fails: justified; consistent with national policy.
Source: Flood Risk Sequential Test Methodology (July 2026) [35], PDF pages 4 and 8; Integrated Impact Assessment Appendices [9], paragraph G.299, PDF page 439; Environment Agency Flood Map [91].
Examination: SUPPORT (three documents, three flood positions, one month). Five-year supply: N/A.
F66. The exception test is circular. The exception test is passed by stating the site is allocated.
Fails: consistent with national policy.
Source: Flood Risk Sequential Test Methodology [35], PDF pages 8 to 9.
Examination: MOD plan-wide. Five-year supply: N/A.
F67. Climate change not assessed for this land. Climate change is modelled only for the tidal Thames; the Level 1 base "uses outdated climate change allowances" (Environment Agency, 2023). The Agency's own Flood Zones plus Climate Change dataset (March 2025) puts about 38 hectares, 17 per cent of the site, in the future flood extent; the Level 2 assessment of February 2026 does not use it.
Fails: justified; consistent with national policy.
Source: Integrated Impact Assessment Appendices [9], PDF page 12 ("uses outdated climate change allowances"); Environment Agency Flood Zones plus Climate Change, March 2025 [91].
Examination: SITE OUT contribution (the developable area is unknown and the Agency's own answer is on the public record). Five-year supply: APPEAL ON SITE.
F68. Run-off to Stanford-le-Hope. Run-off "from the far southwestern corner of the site affects flooding in of [sic] Stanford-le-Hope"; no drainage strategy; Natural England's concern unanswered.
Fails: justified; effective.
Source: Local Plan Initial Proposals (December 2023) [48], PDF page 152 ("from the far southwestern corner of the site affects flooding in of [sic] Stanford-le-Hope"); Regulation 18 Consultation Statement [7], IP0179.
Examination: SITE OUT contribution. Five-year supply: APPLICATION.
F69. Upstream of a Critical Drainage Area and the estuary sites. Critical Drainage Area upstream of the estuary protected sites.
Fails: justified; consistent with national policy.
Source: Level 2 Strategic Flood Risk Assessment [34], PDF page 12 (Critical Drainage Area); Water Cycle Study Scoping Report [43], PDF pages 32 to 33.
Examination: SUPPORT. Five-year supply: N/A.
F70. No sewer, none costed. No sewer ("new infrastructure would be required", WCS 6.1.3), none costed; the only capacity test assessed a different distribution (Lower Langdon at 4,000, West Horndon at 5,000), in which Tilbury's residual headroom fell to 485 homes at 150 litres per head per day (that is the option's result, not the plan's headroom); the water company "noted concern".
Fails: effective; justified.
Source: Water Cycle Study Scoping Report (AECOM, March 2024) [43], paragraph 6.1.3, PDF page 27, and Table 6-1; IDP Schedule Part 2 [31].
Examination: SITE OUT (not effective); plan-wide MOD. Five-year supply: NIL (nothing can connect).
F71. The detailed Water Cycle Study was never produced. The detailed Water Cycle Study promised at Regulation 18 never produced; nothing beyond the 2024 scoping report; the IDP's borough-wide water cost is "Unknown" (Table 13-3, page 176).
Fails: effective; justified.
Source: Water Cycle Study Scoping Report [43]; Infrastructure Delivery Plan (Arup, July 2026) [30], Table 13-3, PDF page 176 (water "Unknown").
Examination: MOD plan-wide. Five-year supply: N/A.
F72. No receiving water body identified. No receiving water body identified: the scoping report treats the Mardyke as Thurrock's only Water Framework Directive catchment and never addresses the brooks south of Langdon Ridge.
Fails: justified; consistent with national policy.
Source: Water Cycle Study Scoping Report [43], PDF pages 14 to 16 and 22 (Mardyke as the only Water Framework Directive catchment).
Examination: SUPPORT. Five-year supply: APPLICATION.
F73. Over a groundwater protection zone. The whole Lower Langdon parcel lies in groundwater Source Protection Zone 3 (Environment Agency mapping; Corringham Park Farm is outside it); scored worse than West Horndon for water.
Fails: justified; consistent with national policy.
Source: Environment Agency Source Protection Zones [91]; Integrated Impact Assessment Appendices [9] (water scoring).
Examination: SUPPORT. Five-year supply: N/A.
F74. Contaminated land named and then ignored. The "Former Works – Basildon" contaminated land designation is named in the site text (page 289), appears in no policy requirement, no HLAA record and no site score; infiltration drainage proposed over it, inside the Source Protection Zone.
Fails: justified; effective.
Source: Regulation 19 Local Plan [1], PDF page 289 ("Former Works - Basildon").
Examination: MOD. Five-year supply: APPLICATION.
F75. The flood risk is modelled, not historic. No recorded flood outline lies within the site (Agency records 1953, 1958, 1968 nearby); the risk is modelled, not historic, which is why the missing model matters.
Fails: justified.
Source: Environment Agency Recorded Flood Outlines and Historic Flood Map [91].
Examination: SUPPORT (context). Five-year supply: N/A.
F76. No soil survey. No agricultural land classification survey; significant negative for soils with and without mitigation.
Fails: justified; consistent with national policy.
Source: Integrated Impact Assessment [8], soils scoring; Natural England Provisional Agricultural Land Classification (ALC) and Post 1988 ALC [121].
Examination: SUPPORT. Five-year supply: N/A.
F77. The only water test was for a different plan. The only treatment capacity test assessed a distribution the plan did not adopt; the detailed Water Cycle Study it called for was never produced; the IDP's connection-cost reassurance applies only to sites near existing wastewater infrastructure, which Lower Langdon is not.
Fails: effective; justified.
Source: Water Cycle Study Scoping Report [43], Table 6-1; Infrastructure Delivery Plan [30], PDF page 75; report/WATER-AND-SEWERAGE-NOTE-2026-09-23.md (Appendix K).
Examination: MOD plan-wide; SITE OUT contribution. Five-year supply: NIL.
F78. SS18 is 44 per cent of the catchment's planned growth. SS18's 12,000 people are about 44 per cent of the population growth Anglian Water's Drainage and Wastewater Management Plan provides for in the whole Tilbury catchment to 2050; the catchment is rated "very significant" for pollution incidents and sewer collapses.
Fails: effective.
Source: Infrastructure Delivery Plan [30], PDF page 75 (Anglian Water DWMP: 153,000 to over 180,000); report/WATER-AND-SEWERAGE-NOTE-2026-09-23.md (Appendix K).
Examination: SUPPORT. Five-year supply: N/A.
F79. No extra treatment capacity permitted. Tilbury WRC's permit, varied 10 December 2025, keeps dry weather flow at 40,000 m3 a day, lower than 2010 to 2016 (42,514); no extra capacity has been permitted for the plan.
Fails: effective.
Source: Environment Agency permit register, Tilbury WRC, variation of 10 December 2025 [114] (Appendix K).
Examination: SITE OUT contribution (not effective); MOD plan-wide. Five-year supply: APPLICATION.
F80. The plan exceeds the water company's allowance. The plan's in-period homes exceed Essex & Suffolk Water's Thurrock allowance (19,460 over 20 years) by 5,946; SS18 is 57 per cent of the excess; the Essex zone's baseline deficit is 35.5 to 43.9 Ml/d and its planned surplus 16.99 Ml/d (0.13 Ml/d without Linford); the excess homes draw about 17 per cent of that surplus. The WCS itself found a 14,020-home shortfall for the highest option.
Fails: effective; consistent with national policy.
Source: Essex & Suffolk Water, WRMP24 final (October 2024) [116]; report/WATER-AND-SEWERAGE-NOTE-2026-09-23.md (Appendix K).
Examination: MOD plan-wide; SITE OUT contribution. Five-year supply: N/A.
F81. The Council itself called the water forecasts too low. Thurrock Council told the water company in 2023 that its growth projections were "very conservative" and its demand-reduction assumptions "overly optimistic"; the water company kept them; the IDP now relies on them for its conclusion that supply is sufficient.
Fails: effective; justified.
Source: Essex & Suffolk Water, Draft WRMP24 Statement of Response, 11 September 2023 [117], refs 69 to 74; Infrastructure Delivery Plan [30], PDF pages 76 to 77.
Examination: SUPPORT. Five-year supply: N/A.
F82. Best and most versatile land never surveyed. Provisional ALC: about 5.4 ha of Grade 2 (best and most versatile) and 209 ha of Grade 3 never surveyed to separate 3a from 3b; ALC scored "for information" only. The land is in continuous arable use: wheat on 106 ha in an average year (61 to 157 ha, 2021 to 2024), about 740 to 910 tonnes of wheat a year, never measured by the Council [142].
Fails: justified; consistent with national policy.
Source: Natural England Provisional ALC and Post 1988 ALC [121]; Integrated Impact Assessment [8]; Rural Payments Agency Crop Map of England 2021 to 2024 and Defra cereal production statistics [142].
Examination: SUPPORT. Five-year supply: N/A.
Tier 5. Infrastructure and delivery
Test engaged: Effective. Developed at sections 5.3 to 5.6.
F83. Infrastructure planned for 4,000 homes, not 5,000. IDP costed for 4,000 homes, not 5,000; Corringham Park Farm appears only as a bus destination and a road end.
Fails: effective.
Source: Infrastructure Delivery Plan [30], PDF page 165 ("the proposed new 4,000 homes at Lower Langdon"); IDP Schedule Part 2 [31].
Examination: SITE OUT (not effective). Five-year supply: NIL.
F84. Everything rests on developer contributions. Everything funded from "Developer Contributions"; gap column blank; the developer loses money before paying.
Fails: effective.
Source: IDP Schedule Part 2, Lower Langdon [31], PDF page 1 (funding "Developer Contributions"; gap column blank); Viability Assessment [29], Table 8.2, PDF page 168.
Examination: SITE OUT. Five-year supply: APPEAL ON SITE (contributions negotiated down).
F85. No provider has confirmed capacity. No provider has confirmed capacity (asked twice by a member at Cabinet, 26 August 2026).
Fails: effective.
Source: Cabinet, 26 August 2026: published minutes [6] and webcast (report/CABINET-2026-08-26-MEETING-TESTED-COMBINED.md); the published evidence base (no provider confirmation).
Examination: SUPPORT plan-wide; SITE OUT contribution. Five-year supply: N/A.
F86. No GP capacity. GP capacity "not available in any of the PCN [Primary Care Network] areas"; the ICB "is not funded to act as a property developer".
Fails: effective.
Source: Infrastructure Delivery Plan [30], PDF pages 123 to 124 ("not available in any of the PCN areas"; the ICB "is not funded to act as a property developer").
Examination: MOD plan-wide. Five-year supply: N/A.
F87. The hospital is described wrongly. Basildon Hospital serves 450,000 and cannot absorb Orsett; no acute assessment; rated inadequate by the CQC on 15 October 2025 (urgent and emergency care inadequate, Section 31 conditions), which the IDP of July 2026 misstates as "good" (2019); 3,700 to 5,600 extra A&E attendances a year from SS18.
Fails: effective; justified.
Source: Infrastructure Delivery Plan [30], PDF page 118; Care Quality Commission, 15 October 2025 [113]; NHS England Digital, A&E activity 2024-25 [119].
Examination: SUPPORT. Five-year supply: N/A.
F88. Rail never tested. c2c and Network Rail never engaged; 361 peak rail trips, 108 extra passengers per service, 66 parking spaces, no capacity test.
Fails: effective.
Source: Lower Langdon Site Specific Assessment [14], Table 6-4, PDF page 36.
Examination: SITE OUT contribution. Five-year supply: APPLICATION.
F89. A junction over capacity with no fix. The A13/B1007/A1014 northbound diverge (node 76225) at 102.55 per cent with mitigation "N/A, further monitoring"; four junctions high impact, all "monitoring".
Fails: effective.
Source: Local Plan Transport Assessment (Arup, August 2026) [32], PDF page 28 (node 76225, A13/B1007/A1014 northbound diverge, 84.95 to 102.55 per cent; "N/A - junction identified for further monitoring").
Examination: SITE OUT contribution; MOD plan-wide. Five-year supply: APPEAL ON SITE (no severe-impact test applied).
F90. Access by country lanes. Northern access via South Avenue (unmade, 445 m) and One Tree Hill (single lane, national speed limit, through the Country Park).
Fails: effective.
Source: Lower Langdon Site Specific Assessment [14], PDF page 10 (One Tree Hill "single-lane carriageway"); IDP Schedule Part 2 [31], PDF page 1 (South Avenue road).
Examination: SITE OUT contribution. Five-year supply: APPLICATION.
F91. Buses and cycling unfunded and untested. Bus and cycle programmes "do not have committed funding"; new bus services "not tested".
Fails: effective.
Source: Local Plan Transport Assessment [32], PDF pages 19 and 24 ("do not have committed funding"); Infrastructure Delivery Plan [30], PDF pages 43 and 46.
Examination: MOD plan-wide. Five-year supply: N/A.
F92. Trip forecasts on old and skewed data. Trip forecasts from 2011 data for one rural census area; the commuting ratio fixed from a pandemic year the consultant calls "skewed".
Fails: effective; justified.
Source: Lower Langdon Site Specific Assessment [14], PDF pages 11 to 12 (2011 data); Housing Needs Assessment (Turley, June 2025) [41], PDF page 30 (2021 commuting ratio "skewed" by the pandemic).
Examination: SUPPORT. Five-year supply: N/A.
F93. Police, fire and library unfunded. Borough-wide police (£21.0 million) and fire (£11.8 million) contributions, and the Lower Langdon library: "Unfunded".
Fails: effective.
Source: IDP Schedule Part 1 (borough-wide), PDF page 5 (police and fire "Unfunded"); IDP Schedule Part 2, Lower Langdon [31] (library "Unfunded").
Examination: SUPPORT. Five-year supply: N/A.
F94. No delivery vehicle, no land assembly. No delivery vehicle, no compulsory purchase costing, no land assembly evidence; one landowner has "total control".
Fails: effective.
Source: Regulation 19 Local Plan [1], Policy SS18 paragraph 9, PDF page 291; Viability Assessment [29], paragraph 8.68, PDF page 166 ("total control").
Examination: SITE OUT contribution. Five-year supply: APPEAL ON SITE.
F95. Traveller pitches in a site that delivers nothing in the first five years from adoption. Twenty Traveller pitches inside a site whose promoter says it delivers nothing in the first five years from adoption (to about 2033), against a five-year pitch need the plan already cannot meet.
Fails: effective.
Source: Regulation 19 Local Plan [1], Policy SS18, PDF page 291 ("20 serviced" pitches); Appendix 2 trajectory, PDF page 419.
Examination: MOD (they must be found elsewhere). Five-year supply: N/A.
F96. No monitoring trigger for failure. Monitoring framework has no trigger for the failure of either new town.
Fails: effective.
Source: Regulation 19 Local Plan [1], Appendix 1, monitoring framework.
Examination: MOD. Five-year supply: APPEAL BOROUGH (no contingency when the towns slip).
F97. Infrastructure spread over the wrong number of homes. The viability study divided the IDP's £256,596,000 by 5,000 homes (£51,325) although the schedule is costed for 4,000, and appraised Corringham Park Farm at a generic £30,000 a home: £64,149 a home on the Council's own figures, before water, sewerage, rail, buses, SANG, land, inflation and optimism bias.
Fails: effective.
Source: Viability Assessment [29], paragraphs 8.64 and 8.72; Infrastructure Delivery Plan [30], Tables 13-3 and 13-4; report/INFRASTRUCTURE-COST-CHECK-NOTE-2026-09-23.md (Appendix J).
Examination: SITE OUT contribution (viability understated). Five-year supply: APPEAL ON SITE.
F98. The appraisals model 5,250 homes and too little infrastructure. The Council's two appraisals model 5,250 homes for a 5,000-home allocation, 4,250 of them on a parcel its own housing land study puts at 3,378, and carry £21.3 million less infrastructure at 5,000 homes than its own IDP total.
Fails: effective; justified.
Source: Viability Assessment [29], appendix appraisals for sites 60940 (PDF pages 1142 to 1148) and 60893 (PDF pages 1205 to 1211); Infrastructure Delivery Plan [30], Tables 13-3 and 13-4; HLAA [15], PDF page 37 (Appendix J).
Examination: SUPPORT (justified). Five-year supply: N/A.
F99. The Council's published maxima do not match its stated test. Table 8.2's maxima (34 and 39 per cent) are reproduced by a land price about 13 times existing use value, not the stated ten; its minus £9.8 million at 50 per cent is not reproduced by the appendix's own sensitivity table.
Fails: effective; justified.
Source: Viability Assessment [29], Table 8.2, PDF pages 168 to 170, and appendix sensitivity tables; report/VIABILITY-REBUILD-NOTE-2026-10-01.md (Appendix J).
Examination: SUPPORT (justified). Five-year supply: N/A.
F100. Corrected only by the Council's own figures, no affordable housing is viable. Rebuilt and corrected only by the Council's own IDP total and capacity figures, SS18 supports at most 30 per cent (IDP) and 17 per cent (capacity) affordable housing, and none once the land its own drainage, woodland and SSSI policies require is set aside.
Fails: effective; justified.
Source: report/VIABILITY-REBUILD-NOTE-2026-10-01.md; evidence/data/viability-ss18-combined-2026-10-01.json; evidence/data/ss18-stepdown-2026-10-01.json (Appendices I and J).
Examination: SITE OUT contribution (effective; exceptional circumstances). Five-year supply: APPEAL ON SITE.
F101. Costs that do not reconcile. One Tree Hill bridge £15,000,000 in the Rough Order of Cost and £22,500,000 in the IDP, exactly 1.5 times, unreconciled; transport costs from "limited" design and a Teams screenshot; 20 per cent contingency, no optimism bias although the IDP says it should be applied.
Fails: effective.
Source: Rough Order of Cost Estimate (18 May 2026) [39]; IDP Schedule Part 2 [31]; Infrastructure Delivery Plan [30], paragraph on optimism bias; report/INFRASTRUCTURE-COST-CHECK-NOTE-2026-09-23.md (Appendix J).
Examination: MOD. Five-year supply: N/A.
F102. Members relied on a hospital rating six years old. The IDP describes Basildon Hospital by a 2019 "good" rating; the CQC rated it inadequate, with conditions, on 15 October 2025. Members relied on an infrastructure document two grades and six years out of date.
Fails: effective; justified.
Source: Infrastructure Delivery Plan [30], PDF page 118; Care Quality Commission, 15 October 2025 [113]; report/HEALTH-CHECK-NOTE-2026-09-23.md.
Examination: SUPPORT. Five-year supply: N/A.
Tier 6. Housing numbers
Test engaged: Justified; effective. Developed at sections 4.5, 5.1 and 6.6.
F103. The 28,880 is a choice. The 28,880 is a choice: "would not be necessary" for baseline growth; the Council "may" plan for it "if it chooses".
Fails: justified; positively prepared.
Source: Housing Needs Assessment [41], paragraphs 4.9 and 4.20, PDF page 31 ("would not be necessary"; "if it chooses").
Examination: MOD (restate the requirement). Five-year supply: BAR UP (1,444 a year instead of 1,077).
F104. The Government minimum already supports more jobs than the plan states. The Government minimum already supports about 20,009 jobs, more than the plan's stated 16,975.
Fails: justified.
Source: Housing Needs Assessment [41], paragraph 4.5, PDF pages 30 to 31 (about 20,009 jobs); Regulation 19 Local Plan [1], Policy SP03, PDF page 36 (16,975).
Examination: SUPPORT. Five-year supply: BAR UP.
F105. A jobs figure the plan never states. 16,975 is a part-figure; housing was sized to 31,166 jobs, never stated.
Fails: justified.
Source: Housing Needs Assessment [41], PDF pages 30 to 31 (31,166); Regulation 19 Local Plan [1], PDF pages 36 and 38 (16,975); EDNA [42], PDF pages 55 and 62.
Examination: SUPPORT. Five-year supply: N/A.
F106. The minimum and the buffer stated several ways. The minimum stated three ways; the buffer as 14 and 24 per cent.
Fails: justified; effective.
Source: Regulation 19 Local Plan [1], PDF pages 34, 43 and 46 ("14%" and "24%"); Cabinet report [4], Table 4; Integrated Impact Assessment [8], paragraphs 2.62 and 2.64.
Examination: MOD. Five-year supply: N/A.
F107. The headline counts homes after 2044. In-period supply 25,406 against 28,880; the 35,906 headline counts 10,500 after 2044.
Fails: justified; effective.
Source: Regulation 19 Local Plan [1], paragraph 4.2.3, PDF page 34, and Table 2, PDF page 43; Appendix 2, PDF page 419.
Examination: MOD (Inspector adjusts). Five-year supply: BAR UP.
F108. SS18 comes late and runs past the plan. SS18 delivers 600 homes by 2033/34 on the plan's trajectory, none in the first five years from adoption on the promoter's account, and 1,600 after the plan ends.
Fails: effective.
Source: Regulation 19 Local Plan [1], Appendix 2 trajectory, PDF page 419.
Examination: SITE OUT contribution (release for post-period need; safeguarded land not used). Five-year supply: NIL.
F109. The plan meets the minimum without SS18. The plan meets the Government minimum without SS18.
Fails: justified.
Source: Regulation 19 Local Plan [1], Table 2, PDF page 43, and Appendix 2, PDF page 419.
Examination: SUPPORT (removal costs nothing). Five-year supply: N/A.
F110. A building rate never achieved. The delivery rate has no precedent: 1,600 to 1,700 homes a year assumed for fifteen years from 2029, against a best year since 2001 of 1,209 gross completions (once, in 2004/05; 1,080 net additional dwellings on the Government's Live Table 122), 855 since 2005, an average of 413 in 2018 to 2024 and 407 in the two years to March 2026. The HNA itself says 1,444 a year is "nearly a fifth more than have been delivered in any single year since at least 2001".
Fails: effective; justified.
Source: Housing Needs Assessment [41], paragraphs 4.15 and 4.20, PDF pages 24 and 34; MHCLG Live Table 122 [112]; Regulation 19 Local Plan [1], Appendix 2, PDF page 419.
Examination: MOD (stepped trajectory) and SUPPORT for SITE OUT (a trajectory that needs SS18 to reach a rate never achieved is not "effective"). Five-year supply: BAR UP.
F111. The jobs uplift is a hand adjustment. The jobs uplift is a hand adjustment, not a forecast: Oxford Economics baseline 729 jobs a year raised to 1,558 by lifting ports and logistics from 0.9 to 2.25 per cent a year and construction from 1.5 to 2 per cent, on "discussions with Freeport landholders", in a table that itself records slowed Freeport delivery and "high levels of uncertainty".
Fails: justified.
Source: Economic Development Needs Assessment (August 2025) [42], paragraphs 4.30 to 4.33 and Table 4.9, PDF page 52.
Examination: MOD (independent validation or restated requirement). Five-year supply: BAR UP.
F112. The Freeport is delivering far less. The Freeport has so far delivered about 1,600 jobs across East London and South Essex (RSA, 12 May 2026) and its own September 2026 Growth Plan promises "up to 12,000" local jobs over 20 years, 600 a year; the plan assumes 1,558 a year in Thurrock alone.
Fails: justified.
Source: Royal Society of Arts, press release, 12 May 2026, and Thames Freeport Growth Plan, September 2026 (Your Thurrock, 14 September 2026) [97].
Examination: MOD. Five-year supply: BAR UP.
F113. Where would the workers live? No document shows where the 31,166 workers would live: the HNA assumes they live in Thurrock; commuting, contractor labour and automation are not modelled; construction jobs are temporary and are used to size permanent homes.
Fails: justified.
Source: Housing Needs Assessment [41], paragraph 4.19, PDF page 35.
Examination: MOD. Five-year supply: N/A.
F114. No housing return for 2024/25. Thurrock submitted no housing return to Government for 2024/25; its figure was imputed.
Fails: justified.
Source: MHCLG Live Table 122 [112], Thurrock 2024-25 (imputed); report/HOUSEBUILDING-RECORD-NATIONAL-COMPARISON-NOTE-2026-09-23.md.
Examination: SUPPORT (monitoring credibility). Five-year supply: BAR UP.
F115. About one year's supply on adoption. 1,457 homes in five years against 7,220; about one year's supply on adoption; 27 per cent Housing Delivery Test.
Fails: effective; consistent with national policy.
Source: Regulation 19 Local Plan [1], Appendix 2, PDF page 419 (1,457 in five years); requirement 1,444 a year (5 x 1,444 = 7,220); Housing Delivery Test 2023 measurement.
Examination: MOD (stepped trajectory required). Five-year supply: APPEAL BOROUGH from the day of adoption; APPEAL ON SITE if allocated.
F116. The stepped trajectory is not set out. The "stepped trajectory" is not set out.
Fails: effective.
Source: Regulation 19 Local Plan [1], Policy SP05 criterion 10, PDF page 44.
Examination: MOD. Five-year supply: BAR UP until it is.
F117. Green Belt released for homes after the plan. Green Belt released for roughly twice the shortfall; 9,300 post-period homes without safeguarded land.
Fails: justified; consistent with national policy.
Source: Regulation 19 Local Plan [1], Appendix 2, PDF page 419; NPPF December 2024 [74], paragraph 149(c) and (d).
Examination: SITE OUT contribution; MOD plan-wide. Five-year supply: N/A.
F118. No urban capacity or brownfield examination. No urban capacity study, density test, justified windfall figure or brownfield examination (NPPF 146).
Fails: justified; consistent with national policy.
Source: NPPF December 2024 [74], paragraph 146; the published evidence base (no urban capacity study); Cabinet report [4], PDF page 13.
Examination: MOD plan-wide; SITE OUT contribution. Five-year supply: N/A.
F119. Almost no council has ever built at this rate. On the Government's own statistics (Live Tables 122 and 125) only two councils in England have sustained, over any twenty years since 2001, the 2.04 per cent annual growth 1,444 homes a year means for Thurrock; no council in Essex has built 1,444 in a single year; Thurrock's best decade averaged 567.
Fails: effective; justified.
Source: MHCLG Live Tables 122 and 125 [112] [118]; report/HOUSEBUILDING-RECORD-NATIONAL-COMPARISON-NOTE-2026-09-23.md (Appendix H).
Examination: MOD (requirement); SUPPORT for SITE OUT. Five-year supply: BAR UP.
F120. Jobs grew with far fewer homes than the plan says are needed. Between 2015 and 2024 Thurrock added about 15,000 jobs and 5,101 net additional homes: about 2.9 jobs per home against the HNA's 1.08. Jobs growth at the plan's assumed rate came with about two fifths of the homes the plan says it needs; the HNA does not model in-commuting.
Fails: justified.
Source: ONS Business Register and Employment Survey [110]; MHCLG Live Table 122 [112]; Housing Needs Assessment [41], paragraph 4.19, PDF page 35; report/BRES-JOBS-RECORD-NOTE-2026-09-23.md (Appendix G).
Examination: MOD. Five-year supply: BAR UP.
F121. The Freeport job capacity is overstated three times. London Gateway, the one Freeport site built, supports one job per 248 square metres on its owner's figures; the EDNA assumes 73.5. The "over 20,000 jobs" Freeport capacity is overstated by about three times.
Fails: justified.
Source: DP World news release, 12 March 2025 [111]; EDNA [42], Table 4.9, PDF page 52; report/LONDON-GATEWAY-DENSITY-NOTE-2026-09-23.md (Appendix G).
Examination: MOD. Five-year supply: BAR UP.
F122. A manufacturing forecast with no precedent. Manufacturing raised from minus 1.7 to plus 5 per cent a year; the borough's record is 1.7 per cent a year over the decade, all before 2019, and decline since.
Fails: justified.
Source: EDNA [42], Table 4.9, PDF page 52; ONS Business Register and Employment Survey [110] (Appendix G).
Examination: SUPPORT. Five-year supply: N/A.
F123. The Freeport reliefs end before SS18 delivers. Freeport tax reliefs expire on 30 September 2031; on the plan's trajectory SS18 reaches 600 homes by 2033/34, and on the promoter's account none in the first five years from adoption (to about 2033). The homes justified by the Freeport arrive after its reliefs end.
Fails: justified; effective.
Source: HM Treasury, Autumn Statement 2023 [123]; Regulation 19 Local Plan [1], Appendix 2, PDF page 419.
Examination: SUPPORT. Five-year supply: N/A.
F124. Brownfield and other capacity never examined. Brownfield Land Register: 3,755 to 3,950 dwellings, three quarters at Purfleet; the examination NPPF paragraph 146 requires (urban capacity, density, windfall, neighbours) not done; 17,055 homes on 79 unallocated HLAA sites found suitable, available and achievable (1,014 non-Green Belt; 1,444 previously developed Green Belt).
Fails: justified; consistent with national policy.
Source: Thurrock Brownfield Land Register, April 2024 [120]; Housing Land Availability Assessment [15] [38]; report/BROWNFIELD-AND-ALTERNATIVES-NOTE-2026-09-23.md and report/REPLACEMENT-SUPPLY-NOTE-2026-09-23.md (Appendix N).
Examination: MOD plan-wide; SITE OUT contribution. Five-year supply: N/A.
Tier 7. What Cabinet was told
Test engaged: Record of what Cabinet was told. Developed at section 4.7.
F125. "Evidence gathering completed". "Evidence gathering completed".
Fails: justified.
Source: Cabinet, 26 August 2026, webcast transcription (report/CABINET-2026-08-26-MEETING-TESTED-COMBINED.md); compare the missing surveys, flood model and water study (F37, F63, F71).
Examination: SUPPORT (record). Five-year supply: N/A.
F126. "Carefully assessed locations". "Carefully assessed locations where boundary changes are necessary".
Fails: justified.
Source: Cabinet webcast, 26 August 2026 (statement A11 in report/CABINET-2026-08-26-MEETING-TESTED-COMBINED.md); Stage 2 Green Belt Assessment, Appendix 4.5 [13], CS-01, PDF pages 4 to 6.
Examination: SUPPORT. Five-year supply: N/A.
F127. "Strengthens protection for environmental assets". "Strengthens protection for environmental assets".
Fails: justified.
Source: Cabinet webcast, 26 August 2026 (statement A12); Regulation 18 Consultation Statement [7], IP0179, PDF page 134.
Examination: SUPPORT. Five-year supply: N/A.
F128. "A thousand in Stifford, Ockendon and Stanford otherwise". "A thousand in Stifford, Ockendon and Stanford otherwise".
Fails: justified.
Source: Cabinet webcast, 26 August 2026 (statement A18); Integrated Impact Assessment [8], Table 2.2, PDF page 53.
Examination: SUPPORT (contradicted by Table 2.2). Five-year supply: N/A.
F129. "Protects Orsett, Bulphan and Horndon". "Protects Orsett, Bulphan and Horndon"; Stanford not mentioned.
Fails: justified.
Source: Cabinet webcast, 26 August 2026 (statements F3, S7, S11, S13); Regulation 19 Local Plan [1], PDF page 33.
Examination: SUPPORT. Five-year supply: N/A.
F130. "Over 30,000 homes". "Over 30,000 homes".
Fails: justified.
Source: Cabinet webcast, 26 August 2026 (statement A20); Regulation 19 Local Plan [1], Table 2, PDF page 43.
Examination: SUPPORT. Five-year supply: BAR UP (members did not know the in-period shortfall).
F131. "The government cannot change this plan". Cllr Willoughby's conditional vote answered with "the government cannot change this plan".
Fails: justified.
Source: Cabinet minutes, 26 August 2026 [6], PDF page 4 (Cllr Willoughby); webcast (statement B5); MHCLG direction to Basildon, 21 July 2026 [95].
Examination: N/A (December vote record). Five-year supply: N/A.
F132. "Commitments from developers". "Commitments from developers".
Fails: justified.
Source: Cabinet webcast, 26 August 2026 (statement F5); Viability Assessment [29], paragraphs 8.63 to 8.68, PDF page 166.
Examination: SUPPORT. Five-year supply: N/A.
F133. The decision was rushed. Planning Inspectorate advisory visits predate every SS18 document; King's Counsel review scope unstated; evidence published 12 to 19 August for a 26 August decision.
Fails: justified; legal compliance.
Source: Cabinet report [4], PDF pages 5 and 19 (advisory visits) and PDF page 6 (paragraph 4.19, King's Counsel review, "sound and legally compliant"); evidence page publication dates, 12 to 19 August 2026.
Examination: SUPPORT. Five-year supply: N/A.
Tier 8. August 2026 Framework, application stage
Test engaged: Effective (August 2026 decision-making policies). Developed at section 5.7.
F134. National policy N6(1)(b) and (3): development affecting a SSSI. N6(1)(b) and N6(3): development affecting a SSSI, inside or outside it, supported only with no adverse effect.
Fails: effective.
Source: National Planning Policy Framework, August 2026 [75], national decision-making policy N6; report/NPPF-AUGUST-2026-NOTE-2026-09-04.md.
Examination: N/A. Five-year supply: NIL (an allocation that cannot be permitted is not supply); APPLICATION refusal default.
F135. National policy N6(2): ancient woodland. N6(2): loss of ancient woodland "should be refused"; the Laindon Road link.
Fails: effective.
Source: NPPF August 2026 [75], policy N6(2); IDP Schedule Part 2 [31], PDF page 1 (Laindon Road link).
Examination: SUPPORT (not effective). Five-year supply: APPLICATION.
F136. National policy N6(1)(a): no appropriate assessment to rely on. N6(1)(a): no appropriate assessment covers SS18 for any application to rely on.
Fails: effective; legal compliance.
Source: NPPF August 2026 [75], policy N6(1)(a); Habitats Regulations Assessment [11] (F1).
Examination: N/A. Five-year supply: APPLICATION.
F137. Golden Rules: 50 per cent affordable on released Green Belt. Golden Rules: 50 per cent affordable default on released Green Belt; unviable at 35.
Fails: effective; consistent with national policy.
Source: NPPF December 2024 [74], paragraphs 156 to 157; NPPF August 2026 [75], policy GB8; Viability Assessment [29], paragraph 8.65 and Table 8.2, PDF pages 166 to 168.
Examination: SUPPORT. Five-year supply: APPEAL ON SITE (viability case cuts it back).
F138. Grey belt and station-led release do not reach this land. Grey belt loosening does not reach this land; station-led release does not reach it.
Fails: consistent with national policy.
Source: NPPF August 2026 [75]; Stage 2 Green Belt Assessment, Appendix 4.5 [13], CS-01, PDF page 6.
Examination: SUPPORT. Five-year supply: APPEAL BOROUGH elsewhere, not here.
F139. Annex A: very limited weight for inconsistent policies. Annex A: the plan's policies get "very limited weight" where inconsistent with national decision policies.
Fails: effective.
Source: NPPF August 2026 [75], Annex A.
Examination: N/A. Five-year supply: APPEAL BOROUGH ("control" is smaller than promised).
Tier 9. Process
Test engaged: Process; positively prepared. Developed at sections 3.5 and 8.
F140. Section 20 certification. Section 20 certification. The Council must certify on submission that it has complied with the legislative requirements and "thinks the document is ready for independent examination"; the Minister's letter of 30 July 2024 says an authority "should not be submitting for examination a deficient plan believing the Inspector will use significant time and resource during the examination to 'fix' it". A Council told that its HRA does not assess SS18 cannot make that certification for the policy without qualification.
Fails: legal compliance.
Source: Planning and Compulsory Purchase Act 2004 [80], section 20; Minister's letter, 30 July 2024 [78].
Examination: SUPPORT (frames the December resolution as the way to submit on the evidence). Five-year supply: N/A.
F141. The Minister's flexibility letters. The Minister's letters of 8 October 2025 and 15 July 2026 tell Inspectors to be flexible on proportionality of evidence and on viability and deliverability for legacy plans. Viability is therefore not run as a free-standing ground; the promoter's non-delivery and the absence of a delivery vehicle are placed inside the exceptional circumstances test for Green Belt release as "a fundamental obstacle to delivery", the 2026 letter's own carve-out.
Fails: context (how the grounds are put).
Source: Minister's letters of 8 October 2025 and 15 July 2026 [78].
Examination: framing, not a flaw. Five-year supply: N/A.
F142. The affected communities were consulted last. No resident on the northern lanes written to; affected-settlement drop-ins last, in working hours; none in Horndon, Fobbing, Langdon Hills, Laindon.
Fails: positively prepared; legal compliance.
Source: Regulation 19 Guidance (September 2026) [51], PDF page 12; Council drop-in schedule [94]; Statement of Community Involvement [53].
Examination: SUPPORT (positively prepared). Five-year supply: N/A.
F143. The first drop-in had no evidence base. First drop-in: one map, one hard copy, no evidence base.
Fails: positively prepared.
Source: report/FILE-NOTE-2026-09-22-GRAYS-DROP-IN.md (my attendance note).
Examination: SUPPORT. Five-year supply: N/A.
F144. Four names for one site. Four names for the site; "North Stanford" 96 times in the July 2026 IIA Appendices, never in the plan.
Fails: positively prepared; legal compliance.
Source: Integrated Impact Assessment Appendices (July 2026) [9]: "North Stanford" 96 times (from PDF page 4); Regulation 19 Local Plan [1] (never used).
Examination: SUPPORT. Five-year supply: N/A.
F145. Appraisal text copied from West Horndon. SS18 appraisal text copied from West Horndon; east and west reversed; a wood that does not exist; the B1007 mislabelled; density 30 to 70 and 30 to 100.
Fails: justified; legal compliance.
Source: Integrated Impact Assessment [8], paragraph 6.433 ("West Horndon village"), PDF pages 399 to 406; Lower Langdon Site Specific Assessment [14] (density 30 to 70 and 30 to 100).
Examination: SUPPORT. Five-year supply: N/A.
F146. Recent buyers relied on a plan that did not propose the site. Purchasers between 2024 and 2026 relied on a draft plan that did not propose the site.
Fails: positively prepared.
Source: Local Plan Initial Proposals (December 2023) [48], PDF page 154 (site not proposed).
Examination: SUPPORT (fairness). Five-year supply: N/A.
F147. The Council is under Best Value intervention. Council under Best Value intervention to April 2028.
Fails: context.
Source: MHCLG Best Value intervention, Thurrock Council, to April 2028 (Commissioners).
Examination: N/A. Five-year supply: N/A (context).
F148. No neighbour's need to meet. The only neighbour to welcome Lower Langdon (Southend) did so for its own unmet need; the plan claims to meet no other authority's need; no statement of common ground exists.
Fails: justified; legal compliance.
Source: Regulation 18 Consultation Statement [7]; report/NEIGHBOURS-NEED-NOTE-2026-09-23.md (Appendix N).
Examination: SUPPORT. Five-year supply: N/A.
F149. The site selection departs from national guidance. The site selection departs from Planning Practice Guidance (Paragraphs 002, 004 and 018) without explanation: Green Belt, priority habitat and landscape carry no weight, and a Green Belt penalty at the method's own middle level would make both new towns unsuitable.
Fails: justified; consistent with national policy.
Source: Planning Practice Guidance, Housing and Economic Land Availability Assessment, paragraphs 002, 004 and 018 [126]; Site Selection Methodology [37]; report/BALANCE-SCORE-NOTE-2026-09-25.md.
Examination: SITE OUT contribution (justified). Five-year supply: N/A.
F150. Allocations on sites the housing land study discounted. Three housing allocations rest on sites the HLAA discounted; SS18 is the largest and the only one discounted as unable to stand as a settlement; no re-assessment is recorded.
Fails: justified.
Source: Housing Land Availability Assessment Appendices [15] and Methodology [125].
Examination: SUPPORT. Five-year supply: N/A.
F151. No common ground with either water company. No statement of common ground with Essex & Suffolk Water or Anglian Water on a plan that exceeds one's supply allowance and sends its sewage to the other's overflowing works.
Fails: effective; legal compliance.
Source: The published evidence base (no statement of common ground); Essex & Suffolk Water WRMP24 [116]; Environment Agency returns [115].
Examination: SUPPORT; MOD plan-wide. Five-year supply: N/A.
Tier 10. Plan-wide
Test engaged: Plan-wide context, not a ground of this representation. Developed at sections 4.1 and 8.
F152. Seven allocations on "Not recommended" Green Belt. Seven strategic allocations on "Not recommended" Green Belt, no reasons.
Fails: plan-wide context.
Source: Stage 2 Green Belt Assessment appendices [13] [44] [45] [46]; report/SITE-SELECTION-RESCORE-NOTE-2026-09-23.md.
Examination: SITE OUT for the weakest; MOD. Five-year supply: N/A.
F153. West Horndon on the Environment Agency's maps. West Horndon on the Environment Agency's own maps (HLAA site 60913, 463 ha): 26 per cent Flood Zone 3, a further 20 per cent Flood Zone 2, half the site in the future flood extent with climate change, 6.8 km of Main River, 36 per cent inside the recorded September 1968 flood outline; the Council's own Sequential Test ranks it 44th of 87. Neither new town's capacity deducts a hectare for it (gis/ea-open-data, plan-wide check, 10 September).
Fails: plan-wide context.
Source: Environment Agency Flood Map, Flood Zones plus Climate Change, Main Rivers and Recorded Flood Outlines [91]; HLAA site 60913 polygon.
Examination: SITE OUT risk at West Horndon; MOD plan-wide (capacity and exception test). Five-year supply: N/A.
F154. Eight "should be avoided" heritage ratings allocated. Eight "Major Adverse, should be avoided" heritage ratings allocated, West Horndon among them.
Fails: plan-wide context.
Source: Heritage Impact Assessment, Housing Sites [36].
Examination: SITE OUT risk at West Horndon, SS13, SS14, SS11. Five-year supply: N/A.
F155. Affordable housing made the variable. Two of fifteen strategic sites carry the affordable housing policy; the Council made affordable housing the variable.
Fails: plan-wide context.
Source: Viability Assessment [29], Table 8.2, PDF pages 168 to 170; Regulation 19 Local Plan [1], Policy DMP12, Table 5, PDF page 317.
Examination: MOD. Five-year supply: N/A.
F156. £1.94 billion with water "Unknown". £1.94 billion, water "Unknown", no gap analysis, transport priced from a screenshot.
Fails: plan-wide context.
Source: Infrastructure Delivery Plan [30], Table 13-3, PDF page 176; Rough Order of Cost Estimate [39].
Examination: MOD (effective). Five-year supply: N/A.
F157. An allocated site the flood study says should not go forward. One allocated site the SFRA says "should not be taken forward"; logistics misclassified as water compatible.
Fails: plan-wide context.
Source: Level 2 Strategic Flood Risk Assessment [34].
Examination: SITE OUT (NS21); MOD. Five-year supply: N/A.
F158. Both new towns without a sewer. Both new towns without a sewer; the only capacity test, for a different distribution, put both treatment works within a few hundred homes of their limit under the highest option; Tilbury's inlet overflow already spills 64 times a year for lack of "Hydraulic capacity" (F12).
Fails: plan-wide context.
Source: Water Cycle Study Scoping Report [43], paragraph 6.1.3, PDF page 27, and Table 6-1; Environment Agency storm overflow returns [115].
Examination: MOD; SITE OUT risk. Five-year supply: N/A.
F159. Traveller pitches: 43 against 140. 43 deliverable Traveller pitches against a five-year need of 140; no site named.
Fails: plan-wide context.
Source: Gypsy and Traveller Accommodation Assessment (March 2026, updated July 2026) [40].
Examination: MOD. Five-year supply: APPEAL BOROUGH (Traveller applications in the Green Belt).
F160. The Council's own land in SS11. The Council's own land in SS11 on terms that may defeat its policy, undeclared.
Fails: plan-wide context.
Source: Regulation 19 Local Plan [1], Policy SS11.
Examination: MOD. Five-year supply: N/A.
F161. No Lower Thames Crossing sensitivity test. No Lower Thames Crossing sensitivity test, which National Highways asked for; Cross Keys mitigation "likely not feasible".
Fails: plan-wide context.
Source: Local Plan Transport Assessment [32]; Thurrock Strategic Transport Model Forecasting Report [33].
Examination: MOD. Five-year supply: N/A.
F162. One year's supply; 27 per cent delivery test. One year's supply on adoption; 27 per cent delivery test.
Fails: plan-wide context.
Source: Regulation 19 Local Plan [1], Appendix 2, PDF page 419; Housing Delivery Test measurement.
Examination: MOD. Five-year supply: APPEAL BOROUGH from adoption.
The independent analyses made for this representation: methods and full results (Appendices G to Q)
The main body of this representation states each result in plain English and refers to the appendix below that sets out how it was obtained. Each appendix gives the question, the data, the method, the full results, what they show, and their limits, with the files that reproduce them. Every dataset is public or licensed and named. Every script is held in the evidence repository, which is available to the Inspector on request, and can be rerun from it. Confidence is stated on this representation's five-point scale, from C1 (weak) to C5 (verified against the source).
Appendix G. Housing need and the jobs forecast, against the borough's own record
The question. The plan's requirement of 28,880 homes, 7,400 above the Government's standard method minimum of 21,480, rests on one jobs scenario. Does the borough's own record support that scenario, and the conversion of its jobs into local homes?
How the requirement was built. The Economic Development Needs Assessment [42] (EDNA, August 2025) takes the independent Oxford Economics (OE) baseline of 729 jobs a year and raises it to a "higher growth" scenario of 1,558 jobs a year (31,166 over twenty years) by lifting, sector by sector, ports and logistics from 0.9 to 2.25 per cent a year, construction from 1.5 to 2 per cent and manufacturing from minus 1.7 to plus 5 per cent, on the basis of "the Thames Gateway Freeport Business Case and recent discussions with Freeport landholders" (paragraphs 4.30 to 4.34, Table 4.9, PDF page 52). The Housing Needs Assessment [41] (HNA, June 2025) converts the 31,166 jobs into 1,444 homes a year on the assumption that the jobs are filled by people living in the borough, holding the 2021 commuting ratio constant (paragraph 4.19, PDF page 35), a census year the HNA itself calls "skewed" by the pandemic (PDF page 30). The HNA states that a requirement above the standard method "would not be necessary" if the Council targeted only baseline job growth, and that 1,444 homes a year "could be needed ... if it chooses to target such levels of job creation" (paragraphs 4.9 and 4.20, PDF page 31).
Data. Office for National Statistics, Business Register and Employment Survey (BRES) [110], Nomis dataset NM_189_1, Thurrock (E06000034), employment (employees plus working owners) by two-digit industry, 2015 to 2024, retrieved 23 September 2026. Government Live Table 122 [112], net additional dwellings, Thurrock. DP World news release of 12 March 2025 on London Gateway Logistics Park [111]. BRES 2024 for the small statistical area containing the port (middle layer super output area E02003296, "Corringham North and London Gateway"). HM Treasury, Autumn Statement 2023 [123] (Freeport tax reliefs).
Method. Compound annual growth rates from BRES for the whole economy and for the sectors the EDNA adjusts, compared with the OE and EDNA rates. Jobs added over 2015 to 2024 set against net additional dwellings over the matching nine years (2015-16 to 2023-24). Floorspace per job at London Gateway from its owner's own figures and from the Council's monitoring (EDNA paragraph 4.48), compared with the 73.5 square metres per job the EDNA applies to warehousing.
Results.
Table G1. Thurrock employment (BRES, rounded as published)
2015 |
2019 |
2020 |
2024 |
Change 2015 to 2024 |
|
|---|---|---|---|---|---|
All sectors |
65,000 |
68,000 |
75,000 |
80,000 |
+15,000 (+23%) |
Transport and storage (divisions 49 to 53) |
8,675 |
11,020 |
16,630 |
19,385 |
+10,710 |
of which warehousing and support (52) |
5,000 |
6,000 |
11,000 |
14,000 |
+9,000 |
Construction (41 to 43) |
3,500 |
5,400 |
5,800 |
7,000 |
+3,500 |
Manufacturing (10 to 33) |
2,645 |
3,335 |
2,915 |
3,070 |
+425 |
Retail (47) |
13,000 |
11,000 |
10,000 |
9,000 |
minus 4,000 |
Table G2. Growth rates, per cent a year (compound)
Record 2015 to 2024 |
Record 2020 to 2024 |
OE baseline 2024 to 2044 |
EDNA higher growth |
|
|---|---|---|---|---|
All sectors |
2.3 |
1.6 |
about 0.8 |
1.55 |
Transport and storage |
9.3 |
3.9 |
0.9 |
2.25 |
Construction |
8.0 |
4.8 |
1.5 |
2.0 |
Manufacturing |
1.7 (minus 1.6 since 2019) |
1.3 |
minus 1.7 |
5.0 |
What it shows.
1. The transport and storage uplift is not without precedent, and this representation does not say it is. The sector grew at 9.3 per cent a year over the decade, so the EDNA is right that 0.9 per cent is "well below historic growth levels".
2. The growth is one division and one step. Of the 15,000 jobs added, 9,000 are in warehousing and support activities, and 5,000 of those arrived in one year, 2019 to 2020. Retail lost 4,000.
3. Manufacturing at 5 per cent a year has no precedent. The record is 1.7 per cent a year over the decade, all of it before 2019, and decline since.
4. The jobs came without the homes. Between 2015 and 2024 the borough added about 15,000 jobs, about 1,670 a year, more than the 1,558 a year the higher growth scenario assumes.
Over the same years it added 5,101 net additional dwellings, about 567 a year: about 2.9 jobs for every new home, against the HNA's 1.08.
On the HNA's own conversion, those jobs needed about 13,900 homes. The borough built about 37 per cent of that. The difference is people who travel in to work, whom the HNA does not model.
5. Illustration only. Applied to the HNA's 31,166 jobs, the recorded ratio implies a housing response in the order of 10,600 homes over twenty years, not 28,880. This is not offered as a forecast. It shows that the uplift rests on a conversion the record does not support.
6. The Freeport's job capacity is overstated about three times. On DP World's own figures London Gateway Logistics Park has 4.0 million square feet (371,612 square metres) and 1,500 permanent jobs: one job per 248 square metres.
The Council's monitoring gives 328,578 square metres completed since 2013/14, 219 square metres per job. BRES records 1,750 warehousing jobs in the whole small area containing the port.
The EDNA applies 73.5 square metres per job, which would have predicted 4,500 to 5,000 jobs from the floorspace already built. The "over 20,000 jobs" Freeport capacity that supports the uplift (EDNA Table 4.9) rests on that ratio.
7. The Freeport reliefs end before SS18 delivers. Freeport tax reliefs expire on 30 September 2031 [123]. The trajectory counts SS18's first 600 homes in the five years 2029/30 to 2033/34, a band that runs more than two years past the reliefs' end, and the promoter says none will come in the first five years from adoption, to about 2033, so on its account none arrive before the reliefs end (Appendix 2, PDF page 419; Viability Assessment [29], 8.67).
8. No neighbour's need is being met. The plan nowhere states that any of its homes meet another authority's need, and the Council told Medway it expected to meet its own need within the borough. The only neighbour to welcome Lower Langdon, Southend-on-Sea, did so as a place for its own unmet need (Regulation 18 Consultation Statement [7]). No statement of common ground records any agreement.
Limits. BRES is a sample survey, rounded to the nearest 5 to 1,000 depending on size, and carries sampling error at division level. Growth rates are compared, not levels, because OE and BRES measure employment differently.
A single-year step in one division may reflect one large employer, a reclassification or a revision. No jobs are attributed to any employer. DP World's "permanent jobs" may exclude agency staff. BRES counts all jobs at the workplace and is if anything generous.
None of these limits reverses a finding. Confidence: C5 for the data and arithmetic. C4 for the interpretation.
Files. report/BRES-JOBS-RECORD-NOTE-2026-09-23.md, report/LONDON-GATEWAY-DENSITY-NOTE-2026-09-23.md, report/NEIGHBOURS-NEED-NOTE-2026-09-23.md, evidence/data/bres-thurrock-2015-2024-employment.json, evidence/data/london-gateway-density-2026-09-23.json, tools/figures_housing_jobs_2026_10_01.py.
Appendix H. The delivery record: the last 24 years, the last ten, and every council in England
The question. Has Thurrock, or any comparable council, ever built at the rate the plan requires: 1,444 net additional homes a year for twenty years?
Data. Government Live Table 122 [112], net additional dwellings by local authority district, 2001-02 to 2024-25 (2024-25 provisional; published 20 November 2025; SHA-256 35667e86...). Live Table 125 [118], dwelling stock by district, 2001 to 2025 (unrounded). Both read in full on 23 September 2026.
Method. Thurrock's annual series, its best five-year and ten-year averages, and its last ten years. For every council in England, the best average over any ten-year and twenty-year run, in absolute terms and relative to its dwelling stock at the start of the run. 1,444 homes a year is 2.04 per cent of Thurrock's 70,871 dwellings (2025). A run counts only if every year has data.
Results.
Table H1. Thurrock's record (Live Table 122)
Net additional dwellings |
|
|---|---|
24 years, 2001-02 to 2024-25 |
11,465 (478 a year) |
Last ten years, 2015-16 to 2024-25 |
5,414 (541 a year) |
Best ten-year average |
567 a year (2011-12 to 2020-21) |
Best single year |
1,080 (2004-05), the only year above 1,000 |
Last five years, 2020-21 to 2024-25 |
1,902 (380 a year) |
Dwelling stock |
59,405 (2001) to 70,871 (2025), +19 per cent in 24 years |
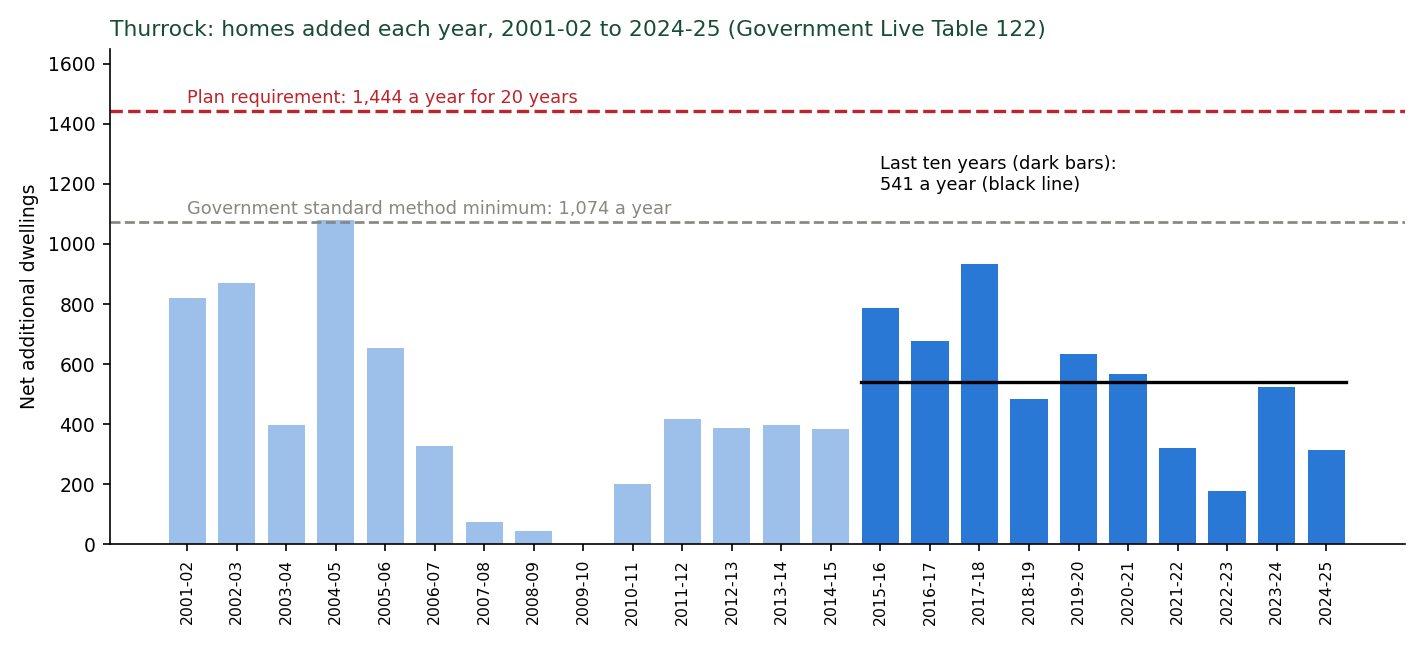
What it shows.
1. Against the last ten years. The requirement is 2.7 times what Thurrock actually built over the last ten years (541 a year), 2.5 times its best decade, and 1.3 times its best single year since 2001, every year for twenty years.
2. Against the borough's size. 28,880 homes in twenty years would take the stock from about 70,900 to about 99,700, +41 per cent, twice the proportional growth of the last 24 years.
3. Against every council in England. Relative to size, 2.04 per cent a year sustained for twenty years has been achieved by 4 of 298 councils with a complete series. Discounting the City of London (5,500 dwellings) and East Lindsey (a statistical artefact) leaves Tower Hamlets and South Derbyshire. Over ten years it is 11 of 326.
4. Against the neighbours. No council in Essex, and none of Medway, Dartford, Gravesham or Havering, has ever built 1,444 homes in a single year. Barking and Dagenham did so once (1,495 in 2024-25). The best ten-year averages in the area are Colchester 974 and Chelmsford 914. Basildon's is 531.
5. What it means for SS18. The Integrated Impact Assessment [8] says the site came back "because of the increased housing requirement being tested" (paragraph 2.61, PDF page 51). The record gives no reason to think that requirement is deliverable. The standard method minimum of 21,480 is already 2.0 times the last decade's rate. Without SS18 the plan still supplies 22,006 homes in its period, above the minimum (Appendix N).
Limits. Net additional dwellings include conversions and changes of use, net of demolitions. 2024-25 is provisional and Thurrock submitted no return for it, so its figure is imputed. The relative test uses stock at the start of each run, which is conservative for Thurrock (its 2025 stock is its largest). Confidence: C5.
Files. report/HOUSEBUILDING-RECORD-NATIONAL-COMPARISON-NOTE-2026-09-23.md, evidence/data/housebuilding-record-lt122-lt125-2026-09-23.json, evidence/data/housing-jobs-figures-2026-10-01.json, tools/figures_housing_jobs_2026_10_01.py.
Appendix I. Capacity: how many homes fit, on the Council's own figures
The question. How many homes can SS18 hold once only the land the Council's own policies require is set aside, counting nothing the Council's consultants have already left out?
The Council's figures. The Housing Land Availability Assessment [15] gives Lower Langdon (site 60940) a capacity of 3,378 homes on 112.61 hectares at 30 dwellings a hectare (HLAA Appendix 4, PDF page 37). The consultants' best practice for Corringham Park Farm is 463 (Site Specific Assessment [14], Table 5-5, PDF page 25). The 1,000 is the Council's "allocation vision", which the consultants say "falls below best-practice standards". Together: 3,841 homes, 1,159 below the policy's 5,000. The consultants' own 4,041 for Lower Langdon depends on one sub-area (LL-01C, 38.2 hectares net) at 50 to 60 dwellings a hectare, the density for extending an existing town, on a stand-alone Green Belt site.
What the consultants already left out. The capacity study's gross developable area excludes Flood Zone 2 with a 10-metre setback, Flood Zone 3 with 15 metres, main rivers with 8 metres, and all woodland and protected habitat with 15 metres (sections 5.2.2 to 5.2.4 and Table 5-1, PDF page 22). Applying exactly that rule to the Environment Agency's data [91] and the Council's parcel boundaries leaves 161.2 hectares at Lower Langdon, against the consultants' 159.78 to 160.40 hectares, which confirms the reconstruction. At Corringham Park Farm it leaves 28.8 hectares, against their 25.74. The climate change flood extent adds only about 0.2 hectares beyond what the study left out. An earlier version of this analysis (23 September) deducted the flood extent again. It double counted about 36 hectares and is withdrawn.
What else must be set aside, and why.
• Drainage. The study allows 4 per cent of the developable land for drainage, about 6.4 hectares at Lower Langdon, with no calculation. Tested against the national standard that the Council's own drainage policy, DMP29, names (Appendix O, Table O5), the drainage needs 19 to 25 hectares at Lower Langdon and 3 to 4 at Corringham Park Farm with ponds at the Essex safe depth of 1.2 metres, including treatment ponds and channels (13 to 19 and 2 to 3 with 2-metre ponds). This appendix uses 20 hectares at Lower Langdon and 4.6 at Corringham Park Farm, 24.6 in all, near the bottom of the 22 to 30 hectares the standard needs with 1.2-metre ponds. Corringham Park Farm's figure is slightly above its own range and Lower Langdon's near the bottom of its.
• Fell-me-down Shaw. Natural England decided on 25 September 2026, confirmed with a map of the whole wood on 1 October 2026, that it is ancient woodland (reference 485493). The study applied 15 metres to all woodland. A 50-metre buffer is used here as a sensitivity, not a claimed standard. Only the ring from 15 to 50 metres is counted.
• Langdon Ridge SSSI. A 50-metre buffer, along the whole northern edge of Lower Langdon's northern part (which local survey places on the SSSI boundary; Natural England's mapped boundary lies up to about 90 metres from it in the middle section) and along Corringham Park Farm's northern edge.
• Lodge Hall Shaw. A 50-metre buffer, if it is confirmed as ancient woodland.
Method. Each buffer is measured only on the developable land left by the consultants' own rule, and each is net of the one before, so nothing is counted twice.
Homes are taken as proportional to housing plot land, using the consultants' own land shares: for Lower Langdon, 3,378 homes on 160.40 hectares with plots at 56 per cent and drainage at 4 per cent. For Corringham Park Farm, 463 on 25.74 hectares with plots at 60 per cent. Land a buffer takes comes off the developable area. Drainage need above 4 per cent comes out of the housing plots. Script: tools/stepdown_2026_10_01.py.
Results.
Table I1. Land each step takes, measured on the land the Council's scheme can build on (hectares)
Lower Langdon |
Corringham Park Farm |
|
|---|---|---|
Land the scheme can build on (consultants' rule) |
161.2 |
28.8 |
Drainage land under the national standard (in total; Appendix O) |
20.0 |
4.6 |
Fell-me-down Shaw, ring from 15 to 50 m |
6.1 |
0 |
SSSI, 50 m |
3.0 |
5.5 |
Lodge Hall Shaw, ring from 15 to 50 m |
2.2 |
0 |
A13 noise bund and fence, 22 m strip along the road edge (Appendix Q) |
3.5 |
2.5 |
SANG to Natural England's standard, beyond the open space already counted (last step) |
25.1 |
2.1 |
Table I2. Homes at each step
Step |
Lower Langdon |
Corringham Park Farm |
SS18 |
Short of 5,000 |
|---|---|---|---|---|
Policy SS18 |
4,000 |
1,000 |
5,000 |
|
Council's own capacity |
3,378 |
463 |
3,841 |
1,159 |
Plus the drainage land its rule needs |
2,867 |
356 |
3,223 |
1,777 |
Plus Fell-me-down Shaw buffer |
2,729 |
356 |
3,085 |
1,915 |
Plus 50 m SSSI buffer |
2,661 |
250 |
2,911 |
2,089 |
Plus Lodge Hall Shaw buffer |
2,611 |
250 |
2,861 |
2,139 |
Plus A13 noise bund and fence |
2,532 |
202 |
2,734 |
2,266 |
Plus SANG to Natural England's standard |
1,964 |
162 |
2,126 |
2,874 |
SANG to Natural England's standard. Natural England's advice on housing near Langdon Ridge applies 8 hectares of SANG per 1,000 new residents, which it calls "a robust standard" [138]. At 2.4 people a home (the IDP's own occupancy) that is 1.92 hectares per 100 homes.
The whole of the capacity study's 10 per cent public open space is counted towards it, which favours the Council, because Natural England does not normally accept amenity open space as SANG. Only the land needed beyond that is taken, from the developable land, split between the parcels in proportion to their homes.
Because the requirement falls as homes are lost, it is solved by iteration. Table I3 shows the result at each step if SANG is set aside instead of the noise bund.
Table I3. Homes at each step with SANG to Natural England's standard (no noise bund)
Step |
Homes without SANG |
SANG needed (ha) |
Counted from open space (ha) |
Extra land (ha) |
Homes with SANG |
|---|---|---|---|---|---|
Council's own capacity |
3,841 |
56.0 |
14.4 |
41.6 |
2,919 |
Plus the drainage land its rule needs |
3,223 |
48.0 |
15.3 |
32.6 |
2,499 |
Plus Fell-me-down Shaw buffer |
3,085 |
46.0 |
14.9 |
31.1 |
2,396 |
Plus 50 m SSSI buffer |
2,911 |
43.4 |
14.2 |
29.2 |
2,261 |
Plus Lodge Hall Shaw buffer |
2,861 |
42.7 |
14.1 |
28.6 |
2,223 |
Plus A13 noise bund and fence |
2,734 |
40.8 |
13.6 |
27.2 |
2,126 |
The maps and charts are Figures 1 to 3 in section 4.4.
The policy's own requirements still have to be placed. None of these figures yet finds room for what Policy SS18 itself requires (PDF pages 291 to 293): about 20 hectares of employment land against a non-residential allowance of 6.4 hectares, two primary schools and an all-through school, about 32 hectares of open space and 1.2 hectares of allotments, about 14 hectares more than the land budget provides, 20 serviced Traveller pitches, and a SANG (Suitable Alternative Natural Greenspace) with no area at all, which Tables I2 and I3 place only as a sensitivity.
Surface water on the land the scheme would build on. On the 161.2 hectares at Lower Langdon, the Environment Agency's surface water map (September 2025) shows 2.7 hectares at High risk (more often than 1 in 30 a year), 1.4 at Medium and 14.9 at Low. On Corringham Park Farm's 28.8 hectares, 2.1, 0.8 and 3.6. In this representation's 1 in 100 year two-dimensional model of today's fields, water stands more than 10 centimetres deep on 10.0 hectares of that land at Lower Langdon and 3.7 at Corringham Park Farm (evidence/data/flood-on-gda-2026-10-01.json). None of this land is excluded by the capacity study, because its rule covers river flood zones only.
Limits. Homes are proportional estimates, not layouts (C3 to C4).
Woodland outlines are OpenStreetMap polygons, slightly wider than the register's areas, so the woodland rings are upper estimates. The 50-metre buffers are sensitivities. The right distance is for the assessment the Council has not done.
Hawksbury Grasslands, nine hectares of priority grassland in Corringham Park Farm, is not deducted (its boundary is not digitised). The drainage land figures come from a screening model (Appendix O). The noise bund strip assumes a 6-metre bund with a steep reinforced road face, a 2-metre crest and a 1 in 3 back slope along the parcel edges within 60 metres of the nearer A13 carriageway. It is not in the plan and is shown because the Council's own 2023 document said the A13 would require noise measures (Appendix Q). The SANG step applies Natural England's standard as stated and assumes a SANG on this land would work. Whether open land on the flat below can draw dog walkers away from a woodland SSSI at the end of the gardens is a separate question (section 4.6). On Figure 2 it is drawn as a band grown from each parcel's SSSI-facing edge only to show the area needed. It is compensatory greenspace, not an SSSI buffer, its real position would be for a design, and it is drawn clear of the drainage land, since drainage basins and open water do not count towards SANG capacity (Natural England's SANG guidelines, August 2021).
Files. tools/fig_v1_land_steps.py, tools/stepdown_2026_10_01.py, evidence/data/fig-v1-land-steps-2026-10-01.json, evidence/data/ss18-stepdown-2026-10-01.json, tools/flood_on_gda_2026_10_01.py, report/LAND-BUDGET-NOTE-2026-09-27.md (with its correction header), report/CAPACITY-RECHECK-NOTE-2026-09-23.md (SSSI boundary lengths and buffer areas; its flood deduction is withdrawn).
Appendix J. Viability and the infrastructure bill
The question. Can the new town pay for itself and still provide the affordable housing the plan requires: 35 per cent on SS18 (Policy DMP12, Table 5, PDF page 317), and 50 per cent on land released from the Green Belt under the Golden Rules?
What the Council tested. The Viability Assessment [29] (AspinallVerdi, June 2026) prints one appraisal for each parcel.
Lower Langdon: 4,250 homes, 34 per cent affordable, infrastructure at £51,325 a home, which is the IDP total of £256,596,000 divided by 5,000 (paragraph 8.64), residual land value £71,559,946 against an existing use value (EUV) of £5,344,773 (PDF pages 1142 to 1148).
Corringham Park Farm: 1,000 homes, 39 per cent, infrastructure at a generic £30,000 a home "in the absence of any further site-specific information" (paragraph 8.72), residual £9,931,510 against an EUV of £726,227 (PDF pages 1205 to 1211). Together: 5,250 homes and £248.1 million of infrastructure.
The infrastructure bill. The IDP's own summary prices Lower Langdon's infrastructure at £256,596,000: transport £172,299,000, education £59,397,000, community £12,074,000, green and blue infrastructure £9,688,000, health £3,138,000 (Tables 13-3 and 13-4). Policy SS18 says the infrastructure for both parcels will be delivered "in line with the Infrastructure Delivery Plan" (PDF page 294).
At the policy's 5,000 homes the appraisals carry £235.3 million (4,000 at £51,325 plus 1,000 at £30,000), £21.3 million less than the Council's own total.
Over the 4,000 homes the IDP says it is costed for ("the proposed new 4,000 homes at Lower Langdon", PDF page 165) the total is £64,149 a home. The transport costs rest on the Rough Order of Cost Estimate [39], built from "limited" design with "no engineering details or proposals" and a "Screenshot of Figure 6-6 provided ... via Teams meeting". They carry a 20 per cent contingency and no optimism bias, although the IDP itself says "relevant adjustments to project cost estimates should be made".
The One Tree Hill bridge is £15,000,000 in the cost estimate and £22,500,000 in the IDP, exactly 1.5 times, with no reconciliation. Neither figure includes water (the IDP's water cost is "Unknown"), wastewater for a site with no sewer, drainage construction, rail, the SANG or land.
Method. Both appraisals were rebuilt line by line from the printed inputs: unit mix, floor areas, sale values, affordable values as a share of market value, build costs, garages, external works at 15 per cent, policy costs, contingency at 5 per cent, fees at 8 per cent, the Building Safety Levy, Section 106 at £18,700 a home, sales and legal costs, profit at 17.5 per cent on market sales and 6 per cent on affordable, and the land deductions (stamp duty at non-residential rates, acquisition fees at 1.5 per cent, one year's land interest at 7.5 per cent).
The rebuild reproduces each printed sales value, total cost and residual land value to the pound.
Development finance comes from a cashflow the Council did not publish and is held at the printed share of pre-finance costs (2.79 and 6.37 per cent). Against the Council's own sensitivity tables (PDF pages 1147 and 1210) the rebuild is within £0.15 million for Lower Langdon between 20 and 35 per cent affordable housing and within £1.3 million for Corringham Park Farm. SS18 is then appraised as one scheme: both parcels at the same affordable housing percentage, the combined land value tested against the combined EUV (£6.07 million).
The land price the Council actually applied. Table 8.2 (PDF pages 168 to 170) says its maxima of 34 and 39 per cent are where land value equals ten times EUV.
The printed appraisals at those percentages leave 13.4 and 13.7 times. Both maxima are reproduced exactly by one threshold of about 13 times (Lower Langdon passes at 34 per cent at 13.4 times and fails at 35 at 12.5; Corringham Park Farm passes at 39 at 13.7 and fails at 40 at 12.3). The "five times" column behaves the same way at about 6.8 times.
On the stated ten times, the Council's own appraisals would allow about 38 and 41 per cent. Its minus £9,802,648 for Lower Langdon at 50 per cent is not reproduced by the appendix's own sensitivity table either (about minus £4.5 million).
The main test below is the one that reproduces the Council's published results. The stated ten times is a sensitivity. (Figure 4, section 5.2.)
What is corrected. Two inputs only.
Infrastructure: the IDP's own £256.6 million at 5,000 homes. Where fewer homes fit, transport (£172.3 million) is held fixed and the rest falls in proportion to the homes (£16,859 a home), which favours the Council. Homes: the policy's 5,000, then the Council's own capacity and the land its own policies require (Appendix I).
Each parcel keeps its own sale values. Nothing the Council has not itself priced is added, with two exceptions shown separately in the last two rows. First, the A13 noise bund and fence the plan does not provide for (Appendix Q), at £2.7 million to £6.5 million (about 4.1 kilometres of acoustic fence at £300 to £500 a metre installed and about 296,000 cubic metres of earthworks at an assumed £5 to £15 a cubic metre), with the land it takes removed as in Appendix I. Second, SANG to Natural England's standard (Appendix I, Table I3), at about £291,000 to £381,000 for each hectare of extra SANG: capital works at the IDP's own rate for natural and semi-natural open space (£181,195 a hectare: 17.28 hectares for £3,131,038, IDP Schedule Part 2 [31]) plus an endowment for 80 years' management of £110,000 to £200,000 a hectare. The endowment range comes from East Devon District Council's 10-hectare Clyst Meadows SANG: £2 million approved in May 2024, revised to £1.1 million on independent financial advice in December 2025. The site works there cost £1.63 million, about £163,000 a hectare, close to the IDP rate [140]. The land for the SANG is not priced. It is paid for in the homes it displaces.
Results.
Table J1. SS18 as one scheme
Case |
Homes |
Infrastructure |
Most affordable housing, Council's applied test |
at the stated ten times |
Land value at 35% |
|---|---|---|---|---|---|
Council's appraisals as printed |
4,250 + 1,000 |
£248.1m |
35% |
38% |
£80.9m |
Policy homes, Council's appraisal rates |
4,000 + 1,000 |
£235.3m |
34% |
38% |
£76.8m |
Policy homes, Council's own IDP total |
4,000 + 1,000 |
£256.6m |
30% |
33% |
£53.4m |
Council's own capacity |
3,378 + 463 |
£237.1m |
17% |
21% |
£7.2m |
Plus drainage land the Council's rule needs |
2,867 + 356 |
£226.6m |
5% |
11% |
minus £23.4m |
Plus Fell-me-down Shaw buffer |
2,729 + 356 |
£224.3m |
2% |
7% |
minus £31.6m |
Plus 50 m SSSI buffer |
2,661 + 250 |
£221.4m |
none |
4% |
minus £38.8m |
Plus Lodge Hall Shaw buffer |
2,611 + 250 |
£220.5m |
none |
2% |
minus £41.8m |
Plus A13 noise bund and fence (£2.7m to £6.5m) |
2,532 + 202 |
£221.1m to £224.9m |
none |
none |
minus £51.1m to minus £55.5m |
Plus SANG to Natural England's standard (bund and SANG, £10.6m to £16.9m) |
1,964 + 162 |
£218.8m to £225.0m |
none |
none |
minus £95.1m to minus £102.4m |
The charts are Figures 4 to 7 in section 5.2.
What it shows.
1. On its own appraisals and its own applied test, SS18 supports 34 per cent affordable housing, below the plan's 35.
2. With the Council's own infrastructure total, 30 per cent. On the Council's own capacity, 17 per cent.
3. Once the land the Council's own drainage, woodland and SSSI policies require is set aside: 5 per cent, then 2, then none. With a 50-metre SSSI buffer the scheme cannot pay the Council's own land price even with no affordable housing.
4. The 50 per cent the Golden Rules expect on released Green Belt is out of reach in every case, including the Council's own.
5. The Council's published summary does not match its own appraisals, and the Council appraised 5,250 homes for a 5,000-home allocation.
6. Mitigating the A13's noise with a bund and fence, which the plan does not provide for, leaves 2,734 homes, the land £51 million to £56 million short at the plan's 35 per cent, and no affordable housing viable even at the stated ten times. Added at each step instead (Figure 6), it lowers every result: 17 per cent to 14 at the Council's own capacity, 5 to 2 with the drainage land, and none from the Fell-me-down Shaw step onward.
7. Protecting the SSSI to Natural England's standard as well leaves 2,126 homes and the land £95 million to £102 million short at the plan's 35 per cent. No affordable housing is viable even at five times existing use value. With SANG alone, at the Council's own capacity and with no other constraint, 2,919 homes and no affordable housing on the applied or the stated test: the land is £56 million to £60 million short at 35 per cent (Figures 6 and 7).
What the Council's bill leaves out. The £256.6 million is the IDP's "known" cost. The items below are absent from it, or carried with no figure. Where the public record allows an estimate, one is given at 2026 prices with its basis and confidence. Where it does not, the item is listed as unpriced, because an unpriced item is not a zero. The full working is in report/OMITTED-COSTS-NOTE-2026-10-07.md.
Table J2. The items the Council's £256.6 million infrastructure bill leaves out, with this representation's estimates.
Item |
In the Council's bill |
Estimate |
Basis and confidence |
|---|---|---|---|
Surface water drainage to the national standard Policy DMP29 names |
No cost; 6.4 ha of land |
£1.6m to £14.8m open SuDS; £9.3m to £40.4m if a quarter of the storage goes underground |
Environment Agency SuDS cost evidence (2015 rates, inflated); 177,000 m3 (Appendix O); C4 |
Drainage maintenance |
Nothing; no owner or funder named |
£86,000 to £528,000 a year; commuted sum £1.3m to £15.8m if adopted |
Same source; C4 |
A13 noise bund and fence, 4.1 km |
Nothing; no noise assessment |
£2.7m to £6.5m plus 6.0 ha of land |
Appendix Q; C4 |
SANG to Natural England's standard |
Listed, no area, no cost |
£7.9m to £10.4m plus 27.2 ha of land |
|
Police, fire and ambulance contributions |
"n/a" for Lower Langdon; sought borough-wide per dwelling by each service |
£6.6m at 5,000 homes (£622, £350 and £350 a dwelling on the IDP's own figures) |
IDP chapter 10; C3 |
RAMS tariff indexation |
£122.30 a dwelling at 2019 base; the IDP's own current rate is £159.66 |
£0.16m understated |
IDP; C3 |
Foul sewerage from a site with "no existing sewer network" |
Nothing |
Unpriced: no route, works or capacity identified |
Water Cycle Study [43]; Appendix K |
Water supply |
"Unknown" |
Unpriced |
IDP Table 13-6; Appendix K |
Two new bus services |
Listed, no figure; "will require central government funding", "not yet fully committed" |
Unpriced |
IDP 4.3.3; Transport Assessment |
Healthcare premises |
£3.1m for 686 m2; the NHS "is not funded to act as a property developer" |
Unpriced beyond the contribution: a building, not a contribution, falls on the development |
IDP chapter 9 |
Land acquisition and compensation, utility diversions, construction inflation |
Nothing; the cost estimate excludes "Tender and Construction inflation" |
Unpriced |
Rough Order of Cost Estimate [39] |
Optimism bias on transport |
None applied; the IDP says Green Book adjustments "should be made" |
Unpriced here |
IDP sections 1.5 and 13 |
Quantified: £20 million to £80 million, 8 to 31 per cent on top of £256.6 million, before the unpriced lines. Per home at 5,000: £4,100 to £16,000 on top of the £51,325 the viability study used. At the 2,126 homes that fit once the Council's own constraints are drawn, the Council's own £256.6 million is already £120,700 a home. The drainage, maintenance and emergency services lines are not yet in the viability model above. The bund and the SANG are, as separate labelled steps. Every line pushes the residual land value further below the Council's own minus £9.8 million.
Limits. Reproduction of the printed appraisals: exact (C5). Finance approximated and checked against the Council's tables. The applied threshold of about 13 times is inferred from the published maxima, which it reproduces exactly for both sites. The Council's reason is unpublished (C4). The fixed and proportional split of infrastructure favours the Council (C4). The reduced home numbers are proportional estimates (Appendix I; C3 to C4). Viability is put inside the effectiveness and exceptional circumstances arguments, not as a free-standing ground (section 8; [78]).
Files. report/VIABILITY-REBUILD-NOTE-2026-10-01.md, tools/viability_model.py, tools/viability_ss18_combined.py, evidence/data/viability-ss18-combined-2026-10-01.json, report/INFRASTRUCTURE-COST-CHECK-NOTE-2026-09-23.md, tools/figures_viability_2026_10_01.py.
Appendix K. Water supply, sewerage and the Tilbury works
The question. Is there a sewer, treatment capacity and water supply for SS18, and does the Habitats Regulations Assessment deal with the works that would treat its sewage?
Data. Water Cycle Study Scoping Report [43] (WCS, AECOM, March 2024), IDP [30], Essex & Suffolk Water (ESW) Water Resources Management Plan 2024, final (October 2024) [116], and its Statement of Response to the draft (September 2023) [117], Environment Agency permit register for Tilbury Water Recycling Centre (WRC) [114], Environment Agency Event Duration Monitoring (EDM) storm overflow returns 2021 to 2025 [115], HRA [11].
Results: sewerage and treatment.
• No sewer. "There is no existing sewer network in some locations to connect into including Fobbing, Langdon Hills, Lower Langdon and West Horndon, therefore new infrastructure would be required" (WCS 6.1.3, PDF page 27). The IDP's reassurance on connection costs applies only to sites "close to existing settlements, where wastewater infrastructure is already established" (page 75). The IDP's Lower Langdon schedule has no sewer, pumping or wastewater item.
• The only capacity test was for a different plan. The WCS tested three options. The highest put 4,000 homes at Lower Langdon (none at Corringham Park Farm) and 5,000 at West Horndon. Tilbury WRC's residual headroom under that option fell to 485 homes at today's water use of 150 litres a head a day, rising to 6,836 or 10,689 only if every new home uses 122 or 110 (Table 6-1). That is the option's result, not the plan's headroom. The detailed Water Cycle Study the scoping report said was needed has never been produced.
• Scale. At the IDP's 2.4 persons a dwelling SS18 houses about 12,000 people, about 44 per cent of the growth Anglian Water's Drainage and Wastewater Management Plan provides for in the whole Tilbury catchment to 2050 (153,000 to over 180,000; IDP page 75). The same plan rates the catchment "very significant" for pollution incidents and sewer collapses (WCS 5.4.1). ESW "noted concern over the ability of treatment works to meet the wastewater demands of new developments in Thurrock" (IDP page 76).
Table K1. Tilbury WRC inlet storm overflow (Environment Agency EDM returns [115])
Year |
Spills |
Hours |
Anglian Water's stated reason |
|---|---|---|---|
2023 (April to December) |
44 |
96 |
|
2024 |
56 |
162 |
"High spill threshold not met" |
2025 |
64 |
142 |
"Not asset maintenance - Hydraulic capacity" |
• The spills rose each year while spills across England fell by about 35 per cent in 2025. Sixty-four is more than five times Anglian Water's 2025 average of 12.0 per overflow. Only 32 of its 1,438 monitored overflows spilled more. "Hydraulic capacity" means "insufficient capacity (conveyance or storage) in the sewer network to cope with the wastewater flow plus typical rainfall" (Environment Agency dataset guide). The 2025 return records "No improvement action in reporting period".
• The permit, varied on 10 December 2025, keeps the dry weather flow at 40,000 cubic metres a day, lower than the 42,514 permitted from 2010 to 2016, and sets no limit on total nitrogen or phosphorus [114]. The outfall is 2.1 km from the Thames Estuary and Marshes Ramsar site and 2.5 km from the Special Protection Area (SPA).
Results
The HRA's water-quality conclusion. The HRA screens in water quality for the Thames Estuary and Marshes SPA and Ramsar site and names the pathway, treated wastewater and "Overloading of the combined sewer network during storm events" (6.77 to 6.79, PDF pages 122 to 123). It then concludes no adverse effect "providing that the mitigation measures and improvements set out by Southern Water are followed" (PDF page 125), relying on Medway, Motney Hill, Canterbury, Sandwich and Gravesend measures in Kent (6.80 to 6.81, PDF pages 123 to 124). Thurrock's sewerage undertaker is Anglian Water (WCS 5.4.1, PDF page 23). In the HRA, "Anglian" occurs 0 times and Tilbury WRC is never named.
Water supply. ESW has a baseline supply deficit in its Essex zone of 35.51 Ml/d (megalitres a day) in 2029/30 and 43.87 in 2034/35, and neighbours with no surplus to share (WRMP24, PDF pages 28 to 29 and 124). Its final plan leaves a zone-wide surplus of 16.99 Ml/d, or 0.13 Ml/d without the new Linford works (PDF pages 174 to 175). The WCS reports that ESW planned for 19,460 homes in Thurrock over a twenty-year plan (6.2.2). The plan's in-period supply is 25,406, 5,946 more. SS18's 3,400 in-period homes are 57 per cent of that excess. At ESW's own ratio (15 Ml/d for 30,000 homes; IDP page 76) the excess homes would use about 3.0 Ml/d, about 17 per cent of the zone's planned surplus. In 2023 the Council told ESW its growth figures were "very conservative" and its demand-reduction assumptions "overly optimistic" (Statement of Response, references 69 to 74, PDF pages 69 to 70). ESW kept them, and the IDP now relies on them.
What it shows. There is no sewer and none is costed. The only treatment test assessed a different plan. The works that would take SS18's sewage already overflows for lack of capacity, more each year. The HRA's water-quality conclusion rests on another water company's works in Kent. The plan exceeds what the water company planned to supply, with SS18 most of the excess. Confidence: C5 for the records. The water arithmetic is an order of magnitude (C4).
Limits. The Thurrock water allowance is the WCS's reading of the plan as it stood in March 2024. The final plan does not publish the local figure. Three years of overflow data is a short record, and the change in the recorded reason may partly reflect a change in the reporting threshold. Distances are straight-line. Anglian Water's reply of 12 October 2026 confirms that it has made no capacity check for the site or the sewers that would serve it (Appendix C).
Files. report/WATER-AND-SEWERAGE-NOTE-2026-09-23.md, report/TILBURY-PERMIT-AND-OVERFLOWS-NOTE-2026-09-23.md, evidence/data/tilbury-wrc-permit-and-edm-2026-09-23.json, evidence/text/esw-wrmp24-final-and-statement-of-response-EXTRACTS.md.
Appendix L. Seventy years of the Council's own decisions on this land
The question. How has the Council itself treated development on and around the allocation?
Data and method. Every application on the eight addresses within and around the allocation (Old Hill Avenue, South Avenue, Vange Park Road, One Tree Hill, Park Road, Hovels Farm, Arden Hall, North Hill), harvested from the Council's online planning register [122] on 3 September 2026: 425 applications, 1948 to 2026. Refusals were coded by primary reason where the decision notice is online.
Results. 168 refusals: 1 in the 1940s, 13 in the 1950s, 31 in the 1960s, 24 in the 1970s, 25 in the 1980s, 11 in the 1990s, 26 in the 2000s, 24 in the 2010s and 13 in the 2020s. Decision notices are online for 40. Of those, 20 were refused primarily on Green Belt grounds, 6 on plotland dwelling limits, 8 on lawfulness or permitted development, 1 on ecology, 4 are scanned notices not yet read and 1 is not applicable. The Green Belt refusals run continuously from 2012 to January 2026, seven months before Cabinet allocated the land: nine extensions or outbuildings, three caravans or mobile homes, three new dwellings, two commercial uses, and one each agricultural, replacement dwelling and equestrian. In the Council's own words: "would harm the openness of the Green Belt" (South Avenue, 2021 and 2022), "inappropriate development in the Green Belt which is by definition harmful" (Old Hill Avenue, 2020), "an unacceptable urbanising feature which is harmful to the openness and rural character of the Green Belt" (land adjacent One Tree Hill, 2012).
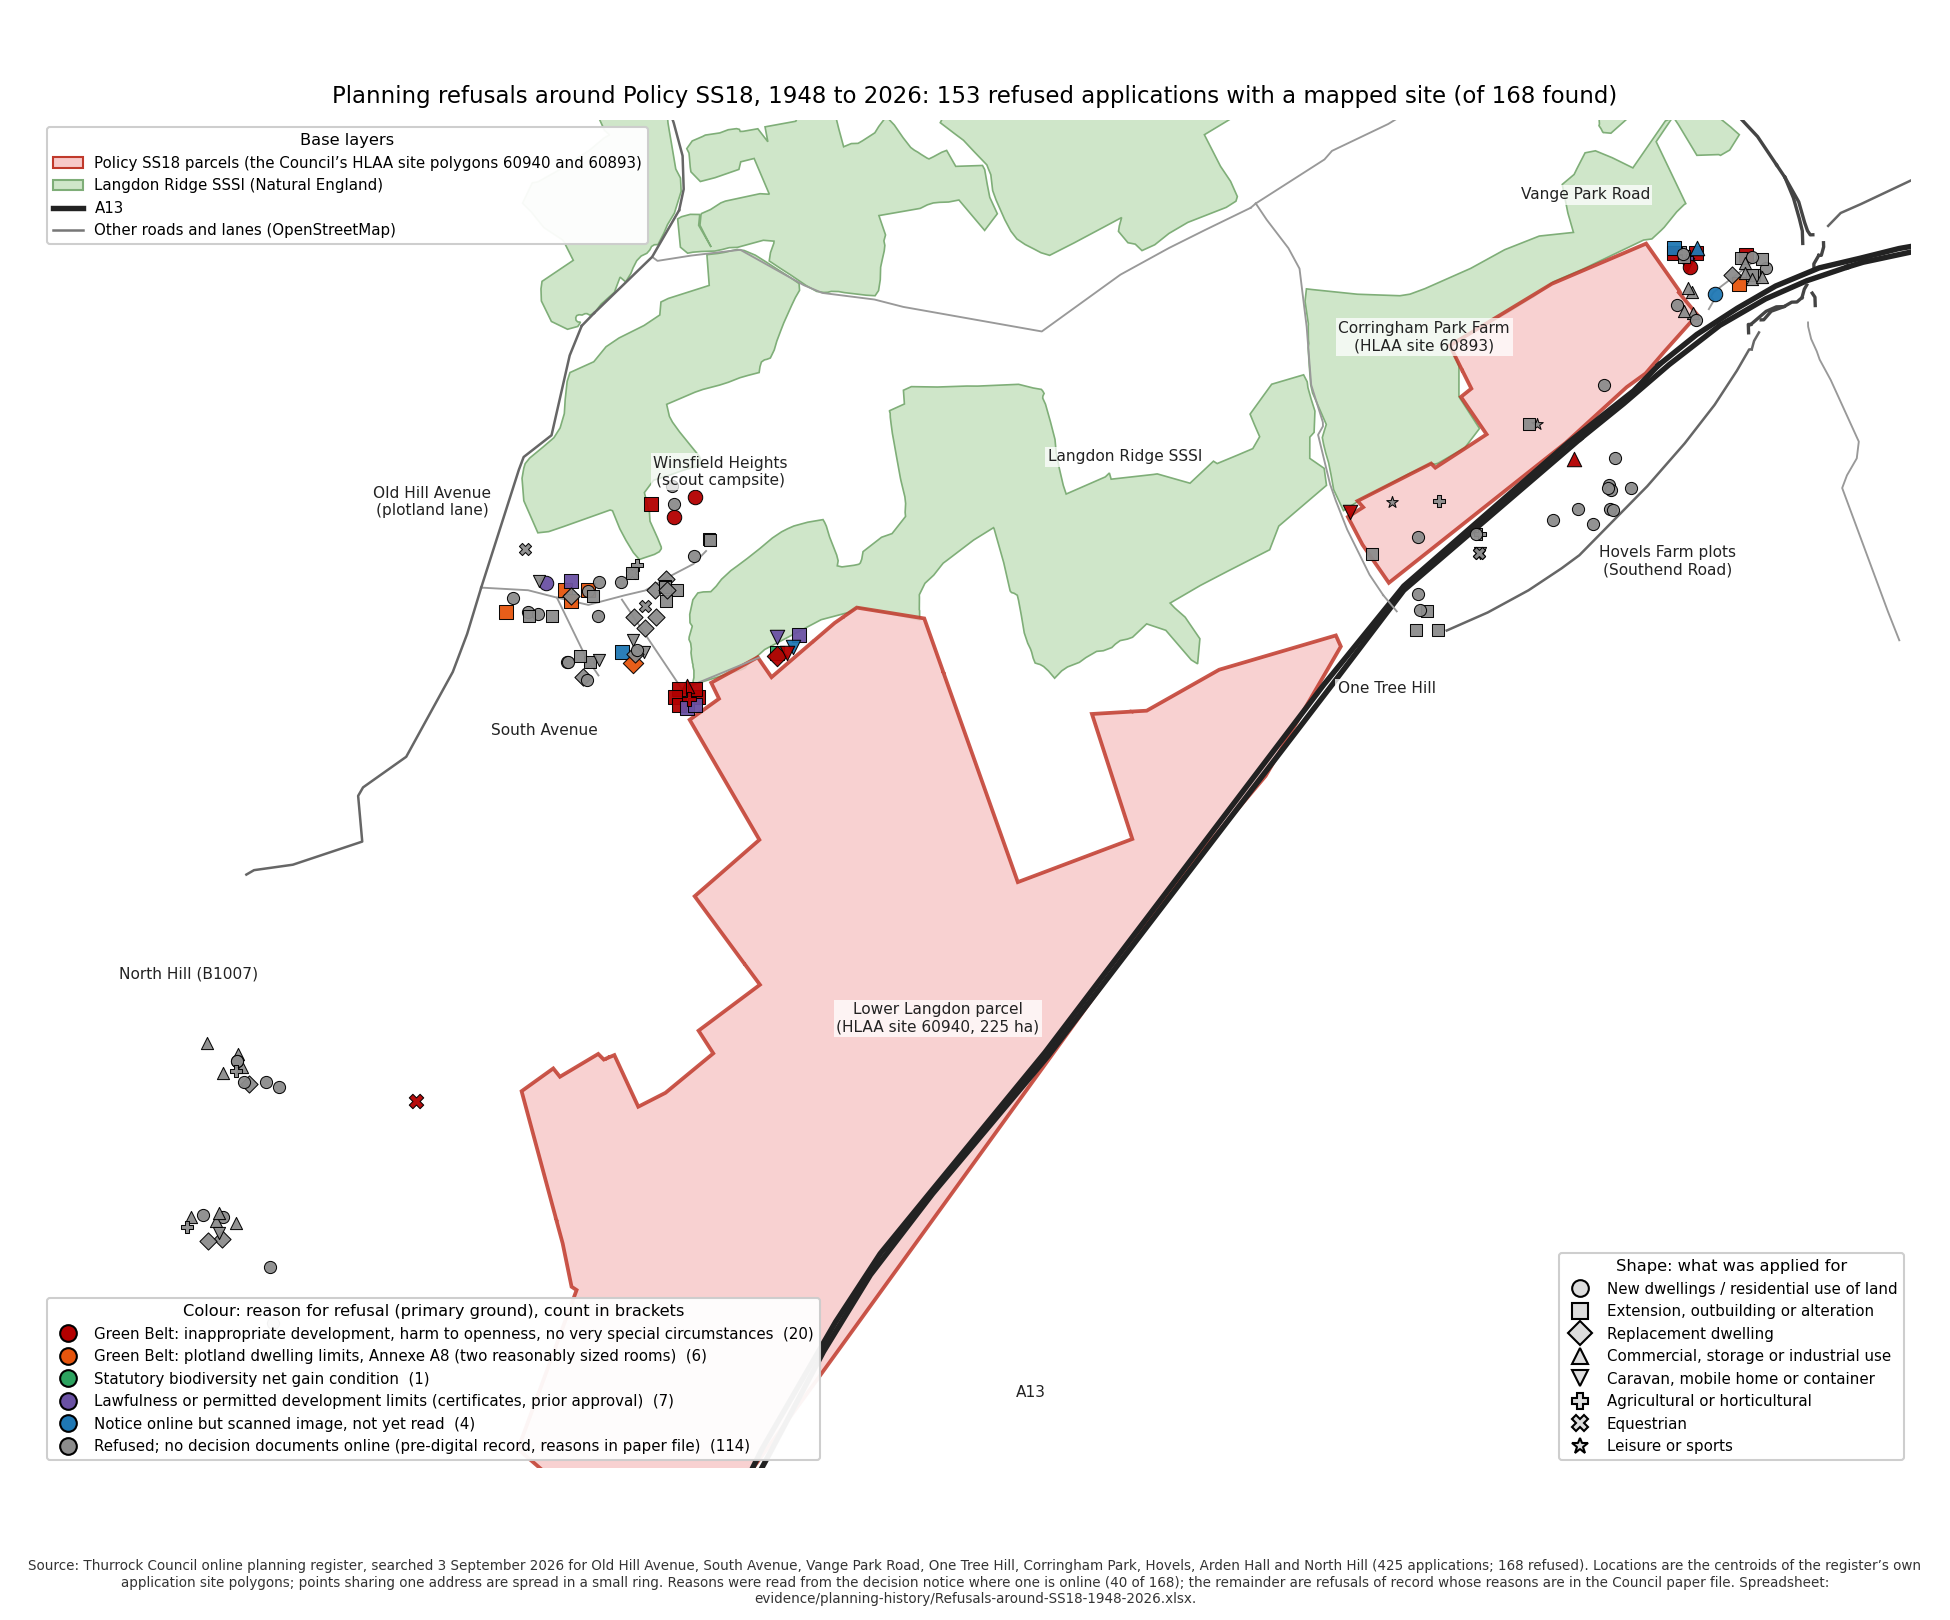
What it shows. For seventy years the Council has refused extensions, outbuildings, mobile homes and single dwellings on and around this land because each would harm its openness. It has allocated the same land for 5,000 homes without recording why that harm no longer applies. Its own Green Belt consultant said in February 2026 that the land "performs strongly" and is "not recommended". Confidence: C5 for the record. 128 pre-digital refusals have no online notice. This does not affect the point, which rests on the 20 documented Green Belt refusals since 2012.
Files. report/PLANNING-HISTORY-NOTE-2026-09-23.md, evidence/planning-history/ (refusals-dataset.json, refusal-reasons-coded.json).
Appendix M. The site selection, re-scored on the Council's own consultants' findings
The question. The Site Selection Methodology [37] scored Green Belt, heritage, priority habitat, Critical Drainage Areas, landscape and Impact Risk Zones "for information" or not at all. What do the Council's own consultants' findings show when set side by side for every strategic allocation?
Data. Stage 2 Green Belt Assessment and appendices [12] [13] [44] [45] [46], Heritage Impact Assessment [36], Environment Agency data [91] checked against every allocation, Flood Risk Sequential Test [35], HLAA Appendices and Methodology [15] [125].
Results.
Table M1. The nine strategic allocations against the Council's own consultants' findings
Allocation |
Homes |
Green Belt finding (Arup) |
Grey belt |
Heritage |
Flood Zone 3 |
Future flood extent |
Main River |
|---|---|---|---|---|---|---|---|
SS17 West Horndon |
10,000 |
Not recommended |
Yes |
Major Adverse |
25.7% |
50.0% |
6.82 km |
SS18 Lower Langdon and Corringham Park Farm |
5,000 |
Not recommended; CS-01 "Strong", 5/5 for preventing towns merging |
No |
Moderate Adverse, "should be avoided" |
10.7% (Parcel a) |
16.8% |
0.96 km |
SS14 North of South Ockendon |
2,000 |
Not recommended |
No |
Major Adverse |
0 |
0 |
0 |
SS13 South-east of South Ockendon |
2,000 |
Not recommended (OK-09) |
mixed |
Major Adverse (part) |
6.7% |
9.3% |
0.01 km |
SS05 East of Chadwell St Mary |
2,000 |
Not recommended (CH-03, CH-06) |
mixed |
Moderate Adverse |
0 |
0 |
0 |
SS04 West of East Tilbury |
830 |
Not recommended |
mixed |
Moderate Adverse |
6.4% |
41.0% |
0 |
SS12 West of Romford Road |
450 |
Not recommended |
Moderate Adverse |
0 |
0 |
0 |
|
SS11 South of Aveley |
600 |
Recommended |
Yes |
Major Adverse |
0.1% |
0.6% |
0 |
SS08 North-east of Corringham |
2,000 |
Recommended |
Yes |
not Major |
1.1% |
1.9% |
0 |
The Green Belt release in proportion. The consultant assessed 145 sub-areas and recommended 88, covering 816 hectares, "7% of the total designated Green Belt land in Thurrock", for further consideration. On the consultant's sub-area descriptions the plan allocates about 848 hectares from the "Not recommended" list, more than the whole 816 the consultant said could be considered. SS18 is 250 of those hectares (CS-01 221.46, CS-11 21.18, CS-28 7.80), 2.1 per cent of the borough's Green Belt, the largest single block the consultant recommended against and the only one that is not grey belt. No reasons are recorded for any of the departures.
How the Council's own score treated the SSSI. The HLAA scored Lower Langdon 68.75: "Balance score reduced due to part of the site falling within Flood Zones 2 & 3 and within a Local Wildlife Site" (HLAA Appendix 4, PDF page 36). The method removes only land inside an absolute constraint and penalises only overlaps above 5 per cent, so the SSSI along the boundary, the Impact Risk Zone, the ancient woodland, priority habitat and the Green Belt cost the site nothing. On the inferred penalty levels (the only set consistent with every other score checked), the 68.75 is the flood zones alone. The two Local Wildlife Sites, at about 2.4 per cent of the parcel, fall below the threshold. The levels themselves are not published.
What it shows. On every constraint the Council's own consultants assessed, SS18 scores worst of the nine strategic allocations, and it is the only one adverse on all of them. The site selection method saw none of this because it weighted none of it.
Limits. Green Belt sub-areas for allocations other than SS18 are matched by the consultant's descriptions, not digitised. SS18's sub-areas are named in the proformas. Flood percentages are this representation's intersections of the Agency's public data. The balance score penalty levels are inferred (C4). Confidence for SS18's row: C5.
Files. report/SITE-SELECTION-RESCORE-NOTE-2026-09-23.md, report/BALANCE-SCORE-NOTE-2026-09-25.md, evidence/data/hlaa-balance-scores-2026-09-25.csv, gis/ea-open-data/allocations-ea-check-2026-09-10.csv.
Appendix N. The alternatives: brownfield land and the Council's own unallocated capacity
The question. Does deleting SS18 leave the plan short of homes, and did the Council examine the alternatives national policy requires before releasing Green Belt (NPPF paragraph 146)?
Data and method. Plan Table 2 and the Appendix 2 trajectory [1], Brownfield Land Register, April 2024 [120], HLAA Appendix 4, every site found suitable, available and achievable, each matched to the plan's allocations through the IIA's and HIA's site references (tools/hlaa_replacement_supply.py).
Results.
Table N1. Supply within the plan period, 2024 to 2044
Homes |
|
|---|---|
Plan supply with SS18 (Table 2) |
25,406 |
SS18 within the period (plan Appendix 2) |
3,400 |
Plan supply without SS18 |
22,006 |
Standard method minimum |
21,480 |
Council's requirement |
28,880 |
Table N2. HLAA sites found suitable, available and achievable that the plan does not allocate
Sites |
Homes |
|
|---|---|---|
Not allocated, all |
79 |
17,055 |
of which not Green Belt |
24 |
1,014 |
of which not Green Belt, without permission, 10 homes or more |
11 |
646 |
of which previously developed land in the Green Belt |
4 |
527 to 1,444 |
of which greenfield Green Belt |
51 |
14,597 |
What it shows.
1. Deleting SS18 leaves the plan above the Government minimum within its period, by 526 homes.
2. The Council's own assessment holds 646 homes on non-Green Belt sites and 527 to 1,444 on previously developed Green Belt land that the plan does not allocate. Adding them lifts the margin over the minimum to between 7.9 and 12.2 per cent without taking any greenfield Green Belt. National policy puts both sources ahead of SS18, which is greenfield and not grey belt.
3. Brownfield alone cannot meet the minimum: the register holds 3,755 to 3,950 dwellings, three quarters at Purfleet. But the examination paragraph 146 requires (an urban capacity study, a density test, a justified windfall figure, discussions with neighbours) has not been done. The register is not that examination.
4. The plan cannot meet its own 28,880 within the period with or without SS18. SS18 does not rescue the requirement.
5. The plan's headline 35,906 includes 10,500 homes after 2044. Deleting SS18 does not leave 30,906 in the period, as earlier material from the Protect Langdon campaign said, but 22,006.
Limits. HLAA capacities are whole-site working figures, not trajectories. Green Belt and brownfield status are taken from the officers' comments. This representation does not name or promote any alternative site. The point is that the Council's own evidence held alternatives it did not examine. Confidence: C4 to C5.
Files. report/REPLACEMENT-SUPPLY-NOTE-2026-09-23.md, report/BROWNFIELD-AND-ALTERNATIVES-NOTE-2026-09-23.md, evidence/data/hlaa-appendix4-sites-2026-09-23.csv, evidence/data/brownfield-register-2024-summary.md.
Appendix O. Flood and surface water: an independent assessment
The question. The Council has no flood model, drainage strategy or site-specific flood risk assessment for SS18. The models below were built in EPA SWMM 5 (rainfall and runoff) and HEC-RAS 7.0.1 (two-dimensional flooding), the software the Environment Agency and the drainage industry use; each is named in full at its method. Where does the water go, how much more would the built site shed, how much land would the Council's own drainage rule need, and what would Stanford-le-Hope receive?
What the Council's evidence contains. The Initial Proposals (2023) [48] record that runoff "from the far southwestern corner of the site affects flooding in of Stanford-le-Hope" (PDF page 152). The Water Cycle Study [43] places the site "within a critical drainage area", on London Clay, draining to the "upper tributaries of Mucking Creek". The Level 2 Strategic Flood Risk Assessment [34] (February 2026) is marked "NOT YET APPROVED FOR ISSUE" and for site 60940 says "This area should be retained as floodplain. Detailed modelling should be undertaken" (PDF page 14). Its site proformas are unpublished. The only site study [14] gives drainage 4 per cent of the developable land, with no calculation, strategy or outfall. The IDP's Lower Langdon schedule contains no flood, drainage, sewer or pumping item. Policy SS18 defers the drainage strategy and "hydrological and flood risk evidence" to a masterplan after allocation. Policy DMP29 requires a site-specific flood risk assessment, greenfield runoff rates and management of "surface flows from offsite".
Data. Environment Agency LiDAR (airborne laser survey) 1-metre terrain model (nine tiles, 26 September 2026), Risk of Flooding from Surface Water (RoFSW, September 2025) with its 2070s allowance, Flood Map for Planning Flood Zones (May 2026) and Flood Zones plus Climate Change, Recorded and Historic Flood Outlines, Main River map, asset register (all [91], Open Government Licence). Flood Estimation Handbook (FEH22) design rainfall and catchment descriptors bought from the Flood Estimation Handbook Web Service on 26 September 2026 for the SS18 outlet catchment (5.12 km²) and the eastern tributary (6.98 km²). London Clay soils (the FEH soil descriptors BFIHOST 0.22 and SPRHOST 48.6, hydrological soil group D).
Method, in three stages.
1. Flow paths. The terrain model was mosaicked at 5 metres for the region and 2 metres for the site, depressions breached and filled, flow directions computed (each cell draining to its steepest neighbour), and every cell of the allocation traced to the first main river it reaches.
2. Runoff and storage. A rainfall-runoff model in EPA SWMM 5 (the United States Environmental Protection Agency's Storm Water Management Model) for the 597 hectares upstream, Lower Langdon, the eastern tributary and Corringham Park Farm, for 30 design storms (1 to 24 hours; 1 in 2 to 1 in 1,000 years; the 1 in 100 year also at plus 25 and plus 40 per cent for climate change). "After" applies the consultants' land budget at 75 per cent hard surface. The storage the site needs to keep its outflow at the greenfield rate was computed on three readings of DMP29 and the Essex SuDS guide, and with the outfall shut for six hours by the tide.
3. Two-dimensional flooding. A HEC-RAS 7.0.1 two-dimensional model (the US Army Corps of Engineers' River Analysis System) of 46 km² including the allocation and Stanford-le-Hope: 115,787 cells on the 2-metre terrain with the main river channels carved through the A13 and railway embankments, land cover and soil by class, rainfall on the whole domain for 30 hours. Two cases are reported for each storm: fields today, and built with no drainage. Runs with the drainage land carved into the ground were also made, but the basins were cut parallel to the slope and held only 4 to 17 per cent of their intended volume, so they do not test the drainage and are not reported. The drainage is tested against the national standard in the runoff model instead (Table O5). Every run was checked for its geometry, land cover and soil layers before computing, and every run's volume error is below 0.15 per cent.
Results
Where the water goes. All of Lower Langdon drains to Stanford Brook and Mucking Creek. None drains to the Mardyke. Corringham Park Farm drains east (96.5 per cent) to the Corringham and Fobbing creeks. 597 hectares of hillside outside the allocation, 2.8 times its area, drains into it and leaves by a single outlet at the south-western tip into Stanford Brook just above the A13. The site study allows no corridor or land for that water.
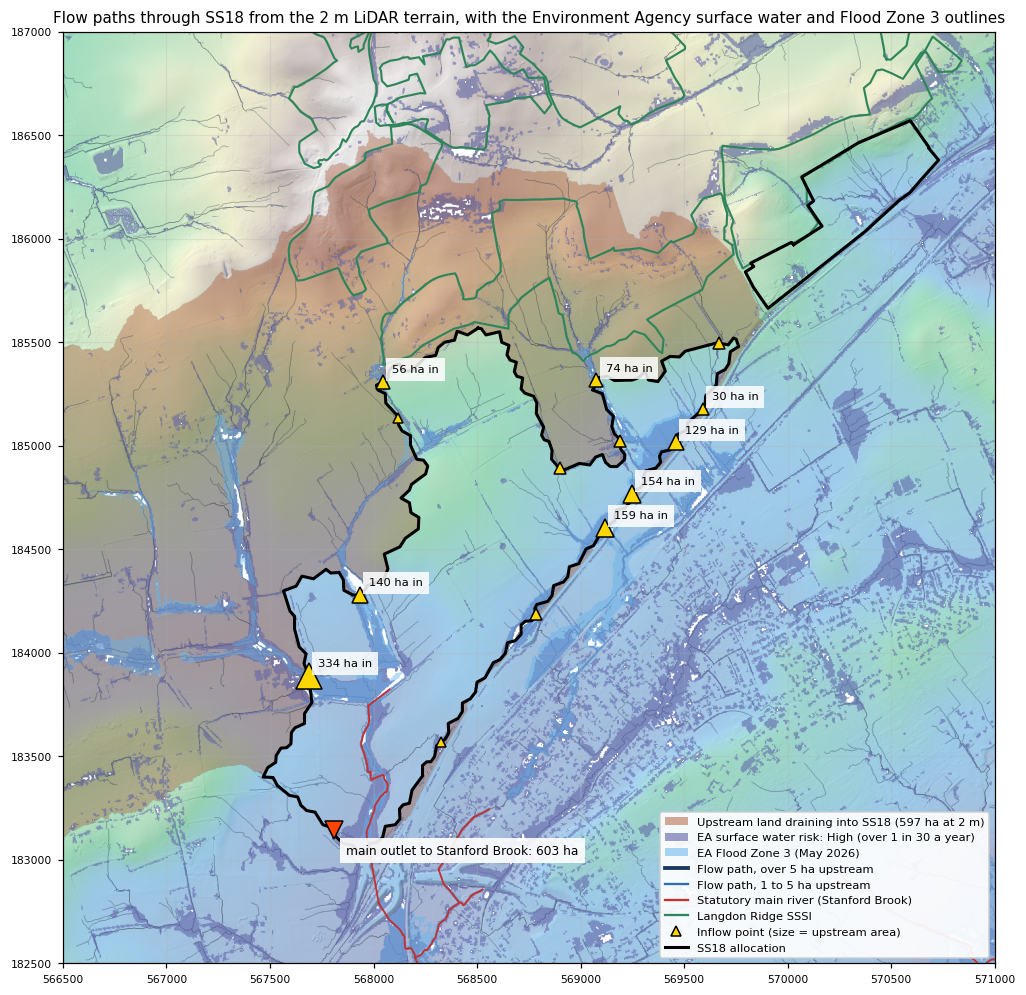
Results
The Agency's maps.
Table O1. Environment Agency flood mapping on the parcels (exact intersections, hectares)
Lower Langdon, whole parcel (225.3) |
of which land the scheme can build on (161.2) |
Corringham Park Farm (29.4) |
|
|---|---|---|---|
Surface water, High (more than 1 in 30 a year) |
30.8 |
2.7 |
2.2 |
Surface water, Medium |
8.8 |
1.4 |
0.8 |
Surface water, Low |
24.0 |
14.9 |
3.6 |
Flood Zone 3, present day |
24.2 (10.7%) |
excluded by the study |
none |
Flood Zone 2, additional |
11.9 (5.3%) |
excluded by the study |
none |
Flood Zone 3 plus climate change |
37.7 (16.8%) |
about 0.2 beyond the study's exclusion |
none |
Before and after.
Table O2. Lower Langdon, 6-hour storms, before any attenuation (SWMM)
Storm |
Rain (mm) |
Peak, fields (m³/s) |
Peak, built (m³/s) |
Volume, fields (m³) |
Volume, built (m³) |
|---|---|---|---|---|---|
1 in 2 year |
23.7 |
0.17 |
4.9 |
2,400 |
21,700 |
1 in 30 year |
50.9 |
1.55 |
16.9 |
39,500 |
70,700 |
1 in 100 year |
65.8 |
2.79 |
23.3 |
66,200 |
100,700 |
1 in 100 plus 40% |
92.1 |
5.77 |
36.0 |
119,700 |
156,800 |
Table O3. Storage Lower Langdon needs (SWMM, critical duration)
Test |
Permitted outflow (m³/s) |
Storage (m³) |
|---|---|---|
National standard, as DMP29 requires: 1 in 100 year plus 40%, held to QBAR (the fields' 50 per cent annual chance runoff rate) |
0.76 |
177,000 |
the same, outfall shut 6 hours by the tide |
0.76 |
193,000 |
For comparison only, not the standard: 1 in 100 year plus 40%, held to today's 1 in 100 year field rate |
2.79 |
105,000 |
For comparison only: 1 in 100 year plus 25%, the same limit |
2.79 |
84,000 |
For comparison only: 1 in 100 year, no climate allowance, held to that storm's field rate |
2.79 |
40,000 |
The Council's 6.4 ha as ponds 1.2 m deep (2 m deep) |
holds 70,000 (111,000) |
The comparison rows are looser tests than the standard and are shown because earlier drafts used them. Under the standard, with ponds at the Essex depth plus treatment ponds and channels, the drainage takes 19 to 25 hectares at Lower Langdon (Table O5; Appendix I uses 20). At the Environment Agency's published unit rates, open drainage would cost in the order of £3 million to £27 million to build and £86,000 to £528,000 a year to maintain (on the smaller volumes of the earlier tests). None of it is in the IDP.
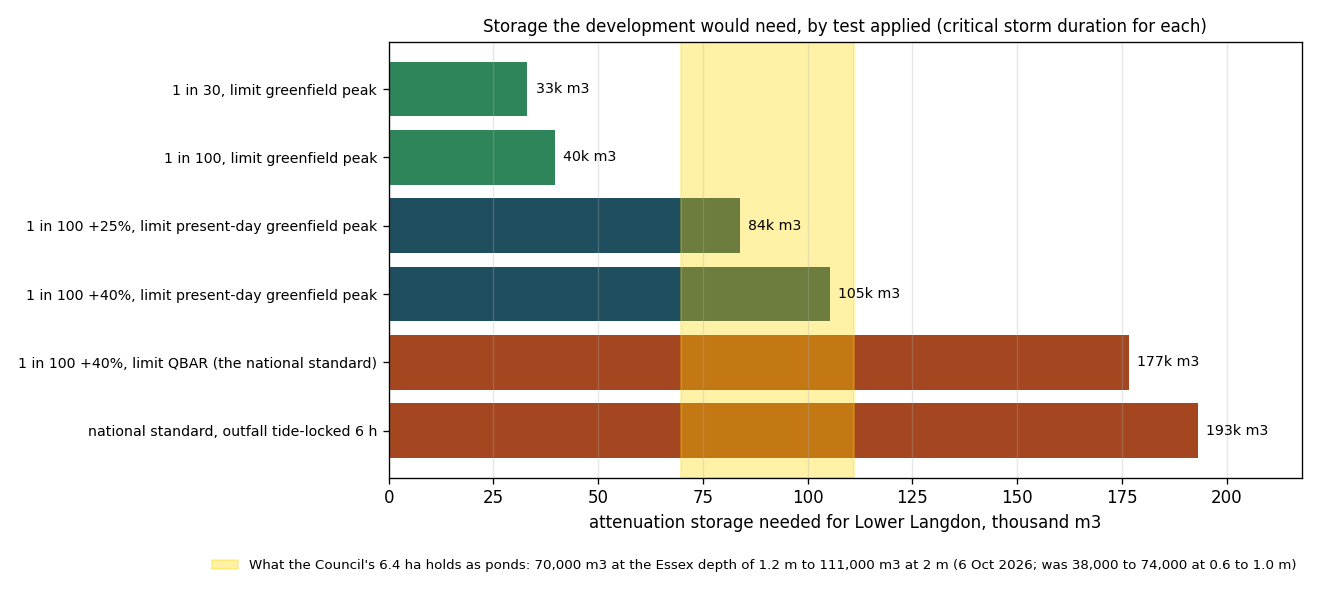
Results:
What Stanford-le-Hope would receive (HEC-RAS).
Table O4. Two-dimensional model, allocation (214.2 ha) and built-up Stanford-le-Hope (342 ha within 1.5 km of the station)
Storm and case |
Runoff from the allocation (m³) |
Peak rate leaving the allocation (m³/s) |
|---|---|---|
1 in 2 year: fields |
11,700 |
15.7 |
built, no drainage |
21,700 |
19.9 |
1 in 100 year: fields |
79,400 |
38.2 |
built, no drainage |
98,700 |
41.9 |
1 in 100 year plus 40%: fields |
129,700 |
45.8 |
built, no drainage |
151,600 |
50.1 |
The 1 in 100 year storm with the Environment Agency's 40 per cent climate change allowance was run on 1 and 5 October 2026. Each run's volume error is 0.02 per cent or less, and the geometry, land cover and soil values were checked cell by cell before use (gis/hecras/STATUS-2026-09-26.md).
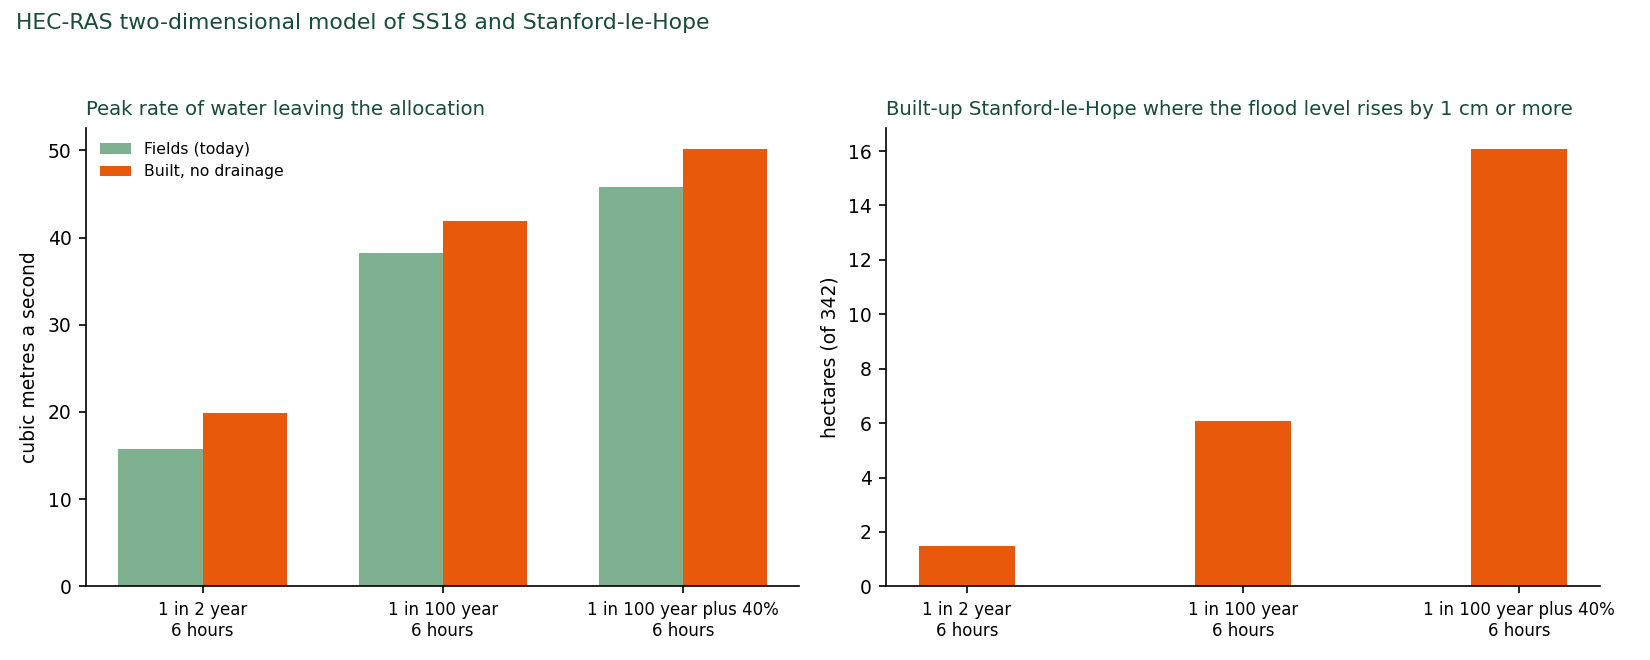
Results
The drainage against the standard the Council's own policy names.
The standard. Policy DMP29 requires drainage to "Achieve greenfield runoff rates (as set out in national standards for SuDs)" (Regulation 19 Local Plan [1], page 341). The national standards (Defra, June 2025, updated July 2025) [141] say that where a site sheds more water once built than as fields in the 1 in 100 year, 6-hour storm, its outflow in the 1 in 100 year storm is limited to the fields' 50 per cent annual chance rate (QBAR, the ordinary yearly flood) or 3 litres a second per hectare, whichever is greater (standard 3.19), that the Environment Agency's Upper End climate allowance is used (3.8; 40 per cent for housing here, 2070s epoch, South Essex catchment), that storage is sized on the critical storm duration (3.23), that 10 per cent is added to hard surfaces within plots for future extensions and paving (3.33), that flood-locking of the outfall is considered (3.39.2), that attenuation sits at several points across the site (3.12), and that drainage features are not placed on land at 1 in 100 year flood risk (3.13). Thurrock is its own flood authority. The Essex County Council SuDS Design Guide [141] applies next door in Basildon and is used here for pond shapes and as a comparator: water no deeper than 1.2 metres (2 metres only with extra safety measures), sides no steeper than 1 in 3. Essex is stricter than the national standard on outflow: it does not accept QBAR and asks for the once-a-year greenfield rate.
The method. The runoff model (item 2) was run for the 1 in 100 year storm plus 40 per cent at durations of 1 to 24 hours. QBAR for Lower Langdon is 0.76 cubic metres a second (3.39 litres a second per hectare, Institute of Hydrology Report 124), above the 3 litres floor. For Corringham Park Farm 0.12. The storage is the largest volume by which the built runoff exceeds that rate. Ponds were sized to Essex's shapes with 0.3 metres of freeboard, as five ponds at Lower Langdon and one at Corringham Park Farm. Treatment ponds and channels add 3.5 to 8 hectares at Lower Langdon (report/WATER-MANAGEMENT-APPRAISAL-2026-09-26.md, 3.3) and a pro rata share at Corringham Park Farm. The Council's land was then tested the same way, as perfect ponds with an outlet releasing exactly the permitted rate, which favours the Council.
Table O5. SS18 against the national standard (1 in 100 year storm plus 40 per cent; runoff model)
Lower Langdon |
Corringham Park Farm |
|
|---|---|---|
Water shed, 1 in 100 year 6-hour storm: fields, built (m³) |
66,200; 100,700 |
9,900; 16,400 |
Permitted outflow in the 1 in 100 year storm (QBAR) |
0.76 m³/s |
0.12 m³/s |
Storage needed (critical duration, 24 hours) |
177,000 m³ |
26,000 m³ |
with the outfall tide-locked for 6 hours |
193,000 m³ |
28,000 m³ |
with urban creep (sensitivity) |
178,000 m³ |
26,100 m³ |
Drainage land needed: ponds 1.2 m deep, treatment ponds and channels |
19 to 25 ha |
3 to 4 ha |
the same with 2 m ponds |
13 to 19 ha |
2 to 3 ha |
Council's allowance |
6.4 ha |
0.5 ha |
What it holds as ponds 1.2 m deep (2 m deep) |
70,000 m³ (111,000) |
5,100 m³ (7,900) |
Share of the storage needed |
39 per cent |
20 per cent |
Average water depth needed to fit the storage in the allowance |
3.9 m |
7.2 m |
Design storm with the Council's ponds: flow to the brook (permitted; today's fields) |
15.2 m³/s (0.76; 8.5) |
8.8 m³/s (0.12; 2.5) |
Overflow once the ponds are full |
107,000 m³ |
20,700 m³ |
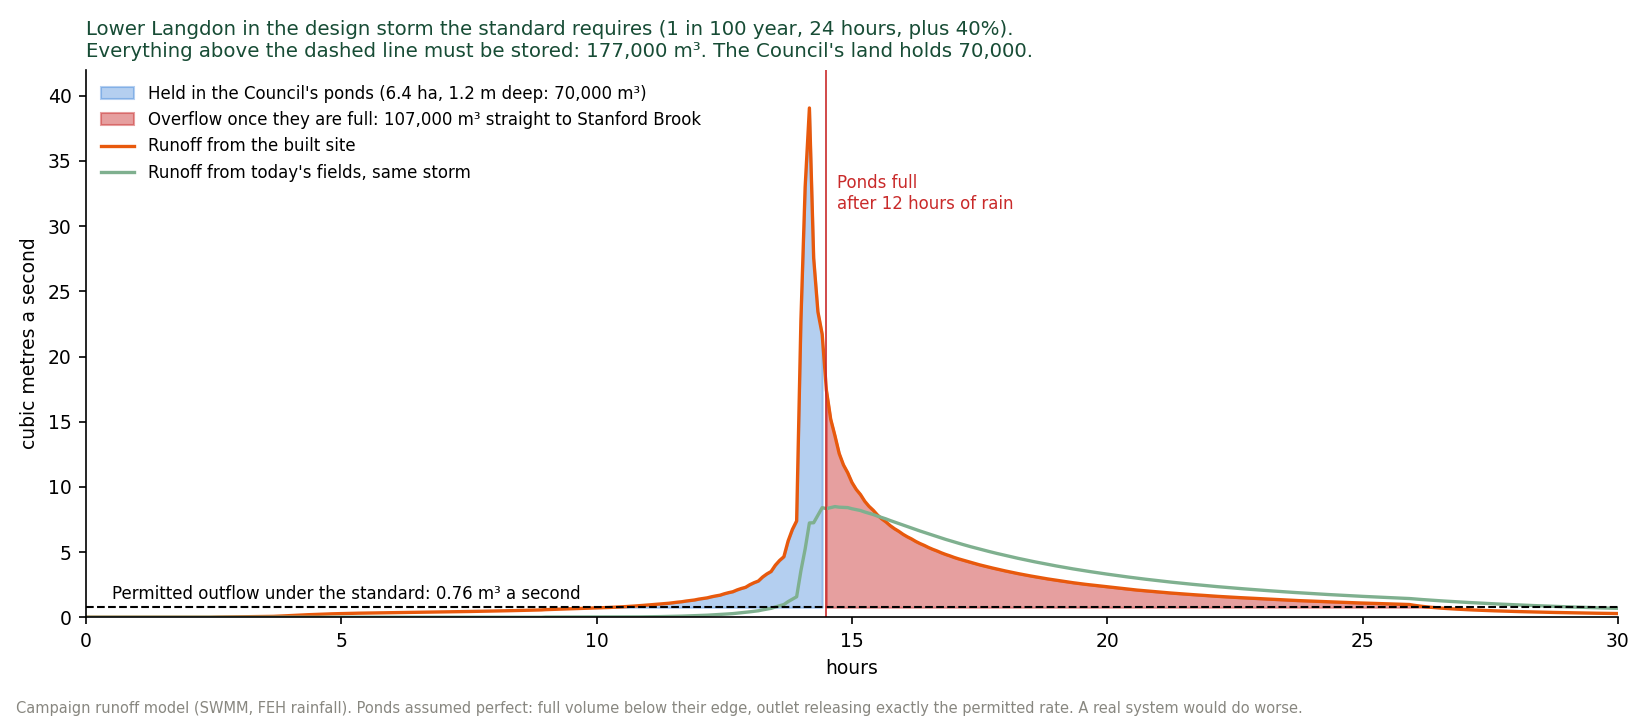
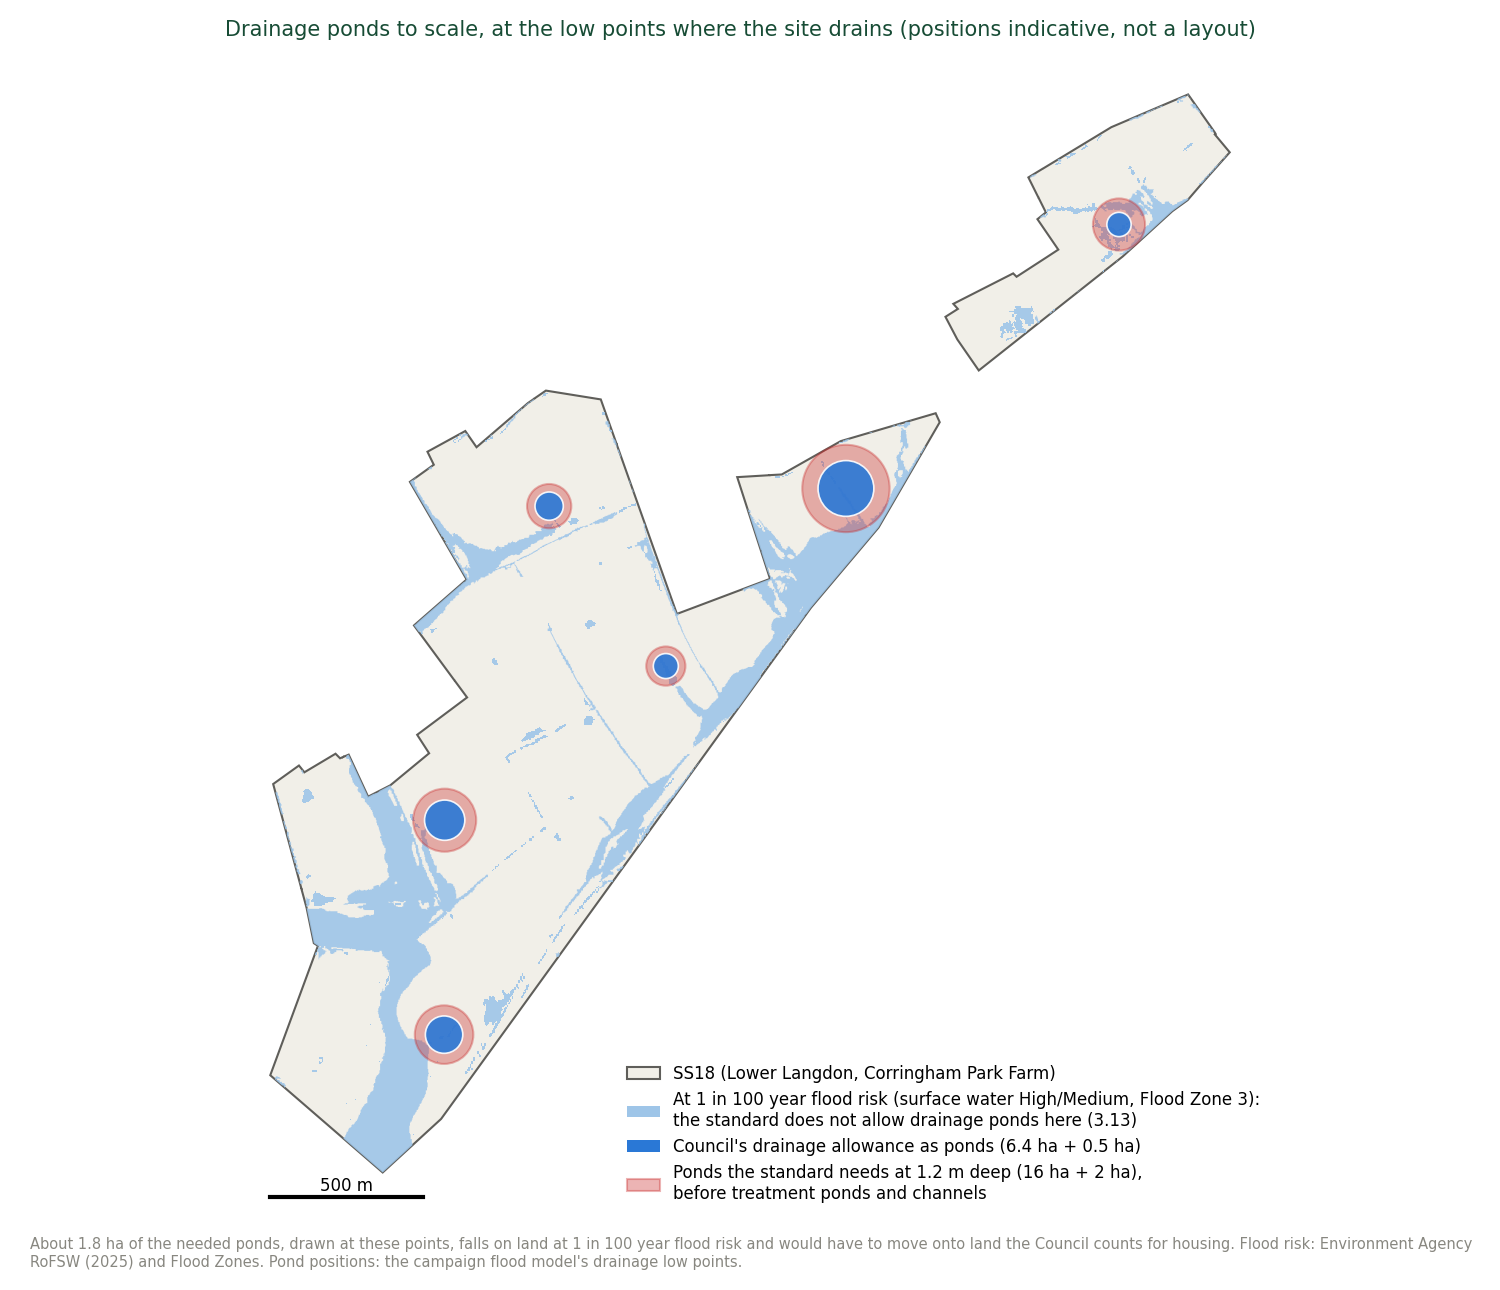
Caveats. These are model estimates, not an engineering design. A drainage engineer with a site layout, ground investigation and the Agency's river model would refine them. A developer could save land with underground tanks or permeable paving, but tanks cost many times more than ponds on a site that is already unviable (Appendix J), and the standard expects attenuation at several points and the Essex guide prefers it above ground. If 2-metre ponds were accepted throughout, the land needed would be 13 to 19 hectares at Lower Langdon, still two to three times the allowance. The 20 hectares at Lower Langdon and 4.6 at Corringham Park Farm used in Appendix I (24.6 together) sit within the 22 to 30 hectares the standard needs with 1.2-metre ponds. With 2-metre ponds throughout they would overstate it by up to about 9 hectares. Scripts: tools/suds_national_standard_2026_10_06.py and tools/fig_suds_standard_2026_10_06.py. Data: evidence/data/suds-national-standard-2026-10-06.json.
What it shows.
1. The site sheds far more water. In the two-dimensional model the built allocation generates about 1.8 times the runoff of today's fields in the frequent storm, a quarter more in the 1 in 100 year storm and about a sixth more in the same storm with the 40 per cent climate change allowance, and the peak rate of water leaving it rises in every storm tested. The runoff model, which treats roofs and roads separately from gardens and verges, gives nine times and half as much again (Table O2). The two-dimensional figures are the lower bound, because that model applies one soil value to the whole built area.
2. The drainage land the Council allowed holds well under half of what its own policy requires. On the national standard that DMP29 names, Lower Langdon must hold back about 177,000 cubic metres in the design storm, about 70 Olympic swimming pools. The Council's 6.4 hectares holds about 70,000 as ponds within the Essex safety limits. To hold it all, the ponds would have to average about 3.9 metres deep (Table O5; Figure 1). In the design storm those ponds fill after about 12 hours and about 107,000 cubic metres then overflows into Stanford Brook, at up to 20 times the permitted rate and nearly twice what today's fields send in the same storm (Figure O4). Corringham Park Farm's 0.5 hectares holds about a fifth of its need.
2A. Checked against the Environment Agency's own river model (added 9 October 2026). The Agency's reply to this representation's information request released the modelled flows and levels of its Stanford 2016 model (CH2M) at ten points on the Main River, seven of them inside the Lower Langdon parcel, present day and with climate change, without defences (Appendix E, item E7; [148]). At the lowest point inside the parcel, 44 metres above the A13 culvert (node 2, 567970/183104), the Agency's 1 in 100 year flow today is 4.6 cubic metres a second, rising to 5.7 with its central climate change allowance (plus 25 per cent) and 7.7 with its upper allowance (plus 70 per cent). Its 1 in 1,000 year flow is 8.9. Three things follow (Table O6; Figure O6).
-
The two models agree on today's brook. This representation's runoff model gives 4.8 cubic metres a second for the fields in the 1 in 100 year, 1-hour storm, within 6 per cent of the Agency's figure. For longer nested storms it gives higher peaks for the fields (10.4 at 6 hours, 15.8 at 24 hours), as a screening model built to put peaks at the top of their range does. The Agency's routed model is the better estimate of today's peak, and this representation adopts it as the baseline from here on. The direction of the difference favours the Council: where the storage calculation holds the built site back to the fields' own peak in the same storm, a lower true baseline means more storage is needed, not less.
-
Built without full attenuation, the site would send the brook a flow the Agency's model has never seen. The built case with no drainage gives 24 to 36 cubic metres a second at the A13 across the storm durations tested (29.6 in the 6-hour storm): five to eight times the Agency's 1 in 100 year flow today, four times its flow with the upper climate change allowance, and nearly three times its 1 in 1,000 year flow. That is the scale of the drainage task the Council's 6.4 hectares is meant to carry, measured against the Agency's own numbers.
-
Climate change raises the Agency's own flood level beside the A13 by more than a metre. At the same point the Agency's 1 in 100 year water level rises from 6.35 metres above datum today to 6.67 with the central allowance and 7.45 with the upper allowance, a rise of 1.1 metres. 500 metres upstream (node 5) the rise is 0.5 metres. The capacity study sets its housing back 15 metres from the present Flood Zone 3 and does not use the Agency's climate change extents at all (Method, item 1). On the Agency's own model the floodplain it builds beside will be deeper and wider over the plan period.
A fourth finding follows from the model files themselves (Products 5 to 7, received 9 October 2026 and held in the repository under the Agency's licence). The Agency's detailed model does not cover the site. The Stanford 2016 model is a one-dimensional river model of the brook joined to a two-dimensional model of the ground. The two-dimensional part covers 272 hectares, almost all of it the town, and takes in 4.5 hectares of the Lower Langdon parcel beside the A13 and none of Corringham Park Farm.
Its 1 in 100 year flood covers 0.7 hectares of the parcel (1.9 with the upper climate change allowance; 3.1 in the 1 in 1,000 year flood), where the published Flood Map draws 24.2 hectares of Flood Zone 3 and 11.9 of Flood Zone 2 on the same parcel.
The Agency's reply explains the difference: the zones on this land are "a combination of local detailed modelling (Stanford 2016 model) and national modelling (New National model)", and the national model "remains a generalised tool intended to inform a high-level risk assessment" which, where used for development proposals, requires "further assessment within the FRA [flood risk assessment] ... to provide reliable flood level, extent, and depth data". In plain terms, the only detailed flood model the Agency holds stops at the A13. The flood zones across the site are broad-scale national mapping. The detailed modelling the Council's own Level 2 assessment says "should be undertaken" has been done by nobody (evidence/data/ea-stanford-model-extents-2026-10-09.json; tools/ea_stanford_model_extents_2026_10_09.py).
The Council's evidence base contains none of these figures, although the Agency holds them for any applicant who asks. They were obtained for this representation in four weeks under the Environmental Information Regulations.
Table O6. The Environment Agency's modelled flows and levels at the A13 (node 2) against this representation's runoff model. Agency: Stanford 2016 model, no defences. This representation: EPA SWMM, upstream catchment plus the Lower Langdon parcel, FEH22 nested storms, peak at the same point. Sources: Product 4 GJ7EVH6M6EA4 [148], evidence/data/ea-product4-comparison-2026-10-09.json, tools/ea_product4_compare_2026_10_09.py.
Case |
Agency flow (m³/s) |
Agency level (metres above Ordnance Datum, m AOD) |
This representation, fields (m³/s) |
This representation, built, no drainage (m³/s) |
|---|---|---|---|---|
1 in 2 year |
1.5 |
5.72 |
1.1 (1 to 24 hours) |
4.5 to 5.9 |
1 in 100 year, today |
4.6 |
6.35 |
4.8 (1 hour) to 15.8 (24 hours) |
24.3 to 35.6 |
1 in 100 year plus 25% |
5.7 |
6.67 |
7.4 (1 hour) to 25.1 (24 hours) |
32.8 to 50.2 |
1 in 100 year plus 35% (Agency) or 40% (this representation) |
6.2 |
6.84 |
9.8 (1 hour) to 31.6 (24 hours) |
38.3 to 59.7 |
1 in 100 year plus 70% |
7.7 |
7.45 |
not run |
not run |
1 in 1,000 year, today |
8.9 |
8.09 |
not run |
not run |
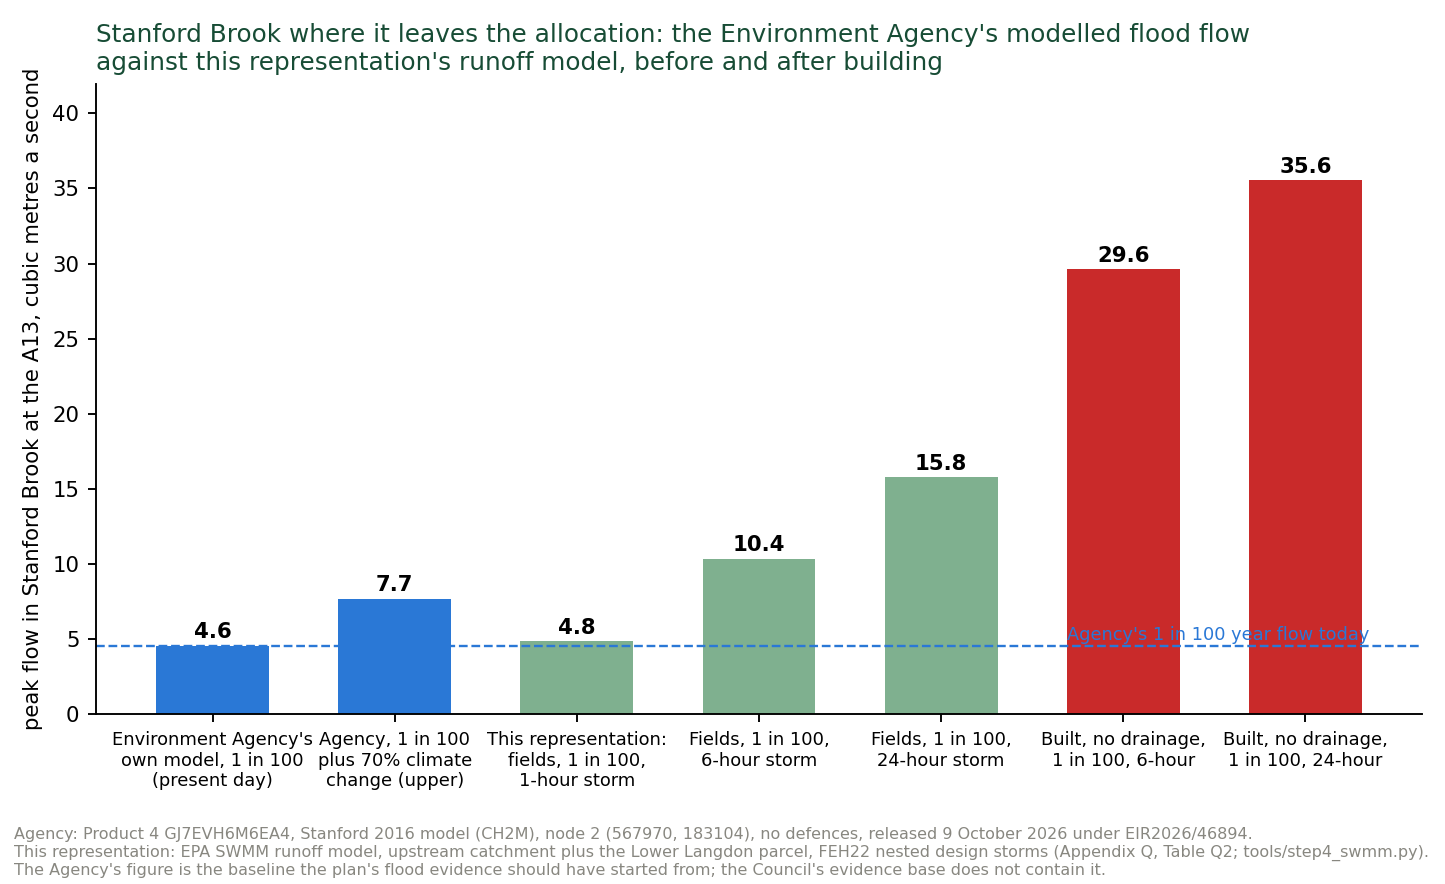
3. The land is not there. The standard needs 19 to 25 hectares of drainage land at Lower Langdon (13 to 19 with 2-metre ponds), three to four times the allowance, and 3 to 4 at Corringham Park Farm. Some of the low points where ponds would naturally go are at 1 in 100 year flood risk, where the standard does not allow them (Figure O5). The difference comes out of the housing (Appendix I) and its cost out of the viability (Appendix J), and neither is in the Council's evidence.
Limits. The runoff model is a screening model: one block per catchment, no sewers or culverts, and a nested storm profile that puts peaks at the top of their range. The volumes and storage needs, which drive land and cost, move by 20 per cent at most across the sensitivity tests (Table 5 of the full appendix). The two-dimensional model has no sewers or field drains, so rain ponds in hollows and on streets: absolute depths are not meaningful and only the before-and-after difference at the outfall is reported. Its "built" land is a 138.5-hectare footprint at curve number 96 without a separate impervious fraction, so it understates the extra runoff. With no drains on the new town it also releases that runoff about as slowly as the fields do, so it understates the effect on the brook. Its drainage runs are withdrawn (Method, item 3). The drainage test against the national standard (Table O5) assumes perfect ponds and outlets, and treatment and conveyance land from this representation's appraisal. See its caveats. The tide-locked outfall at Mucking and the brook's capacity downstream are not modelled because no river model was published when this work was done. On 9 October 2026 the Environment Agency supplied the modelled levels and flows of its Stanford 2016 model at ten nodes on the Main River through and below the site, and offered the model itself under licence. Those flows and levels are compared with this representation's runoff model at result 2A and Table O6: the two agree on today's fields in the 1-hour storm, and the Agency's routed figure is adopted as the baseline for today's peak. The model itself has not yet been run (Appendix C). Confidence: C4 for the storage and land figures. C4 for the two-dimensional differences. C5 for the Agency's mapped extents.
Files. report/APPENDIX-FLOOD-MODELLING-2026-09-26.md (full method, all 30 storms and the sensitivity tests), report/FLOW-PATHS-NOTE-2026-09-26.md, report/SWMM-MODEL-NOTE-2026-09-26.md, gis/hecras/STATUS-2026-09-26.md (run-by-run record and checks), gis/hecras/results/, evidence/data/swmm-ss18-2026-09-26.json, evidence/data/hecras-summary-2026-10-01.json, evidence/data/flood-on-gda-2026-10-01.json.
Appendix P. Health: the hospital the evidence describes wrongly, and the demand it does not count
The question. What acute and primary care capacity does the Council's evidence show for SS18's 12,000 people?
Data. IDP [30], Care Quality Commission (CQC) press release, 15 October 2025 [113], NHS England Digital, Hospital Accident and Emergency Activity 2024-25 [119].
Results. The IDP (July 2026) states: "The most recent Care Quality Commission inspection of the Hospital took place in 2019. The commission rated the trust as good overall" (PDF page 118). On 15 October 2025 the CQC rated Basildon University Hospital inadequate, with urgent and emergency services inadequate for safe and well-led, and imposed conditions on the provider's registration under Section 31 "because people would be at risk of harm if it did not take this action". England recorded 27.4 million A&E attendances in 2024-25, about 0.47 per person. 12,000 people therefore imply in the order of 3,700 to 5,600 more attendances a year, most at Basildon. The words "A&E", "accident and emergency" and "emergency department" appear in none of the plan, the IIA, the HRA, the Consultation Statement, the Cabinet report or the site transport assessment, and the trust that runs the hospital is not among the bodies consulted. For primary care the Integrated Care Board records GP capacity "not available in any of the PCN areas" (primary care networks) and that it "is not funded to act as a property developer" (IDP PDF pages 123 to 124). Policy SS18 provides about 600 square metres for a population that needs about seven GPs.
What it shows. Members approved the plan on an infrastructure document that describes the borough's acute hospital by a rating six years old and two grades out of date, and that contains no acute care assessment at all. Confidence: C5 for the records. The attendance figure is an order of magnitude (C4).
Files. report/HEALTH-CHECK-NOTE-2026-09-23.md.
Appendix Q. Road noise from the A13: the Government's noise maps across the site
The question. How much of the land allocated for homes is already exposed to road noise above the levels the World Health Organization and the British Standard for homes set, and what has the Council done about it?
What the Council's evidence says. No published document assesses noise on SS18, and none proposes a noise barrier, acoustic fence or earth bund. Policy SS18 contains no noise requirement. The IIA [8] scores SS18 significant positive for health while noting that the policy does not address noise (paragraph 6.426). The Council's 2023 Initial Proposals said of Lower Langdon: "The proximity of this site to the A13 will limit the developable area of the site as well trigger the need to consider ways to reduce the impact noise could have on future residents" (PDF page 152). The site study [14] proposes to "Utilise green corridors and the placement of non-residential uses to create a buffer reducing negative impacts from Stanford-Le-Hope Bypass" (PDF page 27), but records that road setbacks "have not been deducted from the Gross Developable Land Area" and are instead counted within the 4 per cent of land set aside for habitat corridors, hedgerows, woodland edges and ponds (PDF pages 22 and 24 to 25). No land was set aside for a buffer, and the developable area was not reduced.
Data. Defra Strategic Noise Mapping, Round 4: road noise from all roads, modelled for 2021 traffic on a 10 metre grid at a height of 4 metres (about first-floor window level), for three measures: LAeq,16h, the average over the day from 07:00 to 23:00, Lden, the 24-hour average with penalties for the evening and night, and Lnight, the average from 23:00 to 07:00 [134].
Method. Every 10 metre cell whose centre lies inside the allocation was counted: for Lower Langdon, the boundary traced from the Policies Map (214.6 hectares). For Corringham Park Farm, which the traced boundary does not include, the Council's own housing land site 60893 (29.4 hectares) [38]. Together 244 hectares, against the policy's approximately 250. The thresholds are the World Health Organization's Environmental Noise Guidelines (2018) for road traffic, Lden 53 dB and Lnight 45 dB, and BS 8233:2014 for outdoor amenity space such as gardens, desirably no more than 50 dB LAeq and an upper guideline of 55 dB. [134]
Table Q1. The share of each parcel at or above each noise level, by day and by night.
Share of land at or above the threshold |
Lower Langdon (214.6 ha) |
Corringham Park Farm (29.4 ha) |
SS18 (244.1 ha) |
|---|---|---|---|
WHO road traffic limit, Lden 53 dB |
54% |
100% |
59% (144 ha) |
WHO night limit, Lnight 45 dB |
54% |
100% |
59% (144 ha) |
BS 8233 gardens, desirable, LAeq,16h 50 dB |
54% |
100% |
60% (146 ha) |
BS 8233 gardens, upper guideline, LAeq,16h 55 dB |
30% |
69% |
35% (85 ha) |
LAeq,16h 60 dB |
14% |
31% |
17% (40 ha) |
Median levels across the allocation: LAeq,16h 51.9 dB, Lden 54.7 dB, Lnight 46.7 dB. Up to about 80 dB beside the A13. Measured by distance from the A13, the daytime level falls below the British Standard's upper guideline for gardens (55 dB) only beyond about 300 metres, and below its desirable level (50 dB) and the WHO night limit only beyond about 500 metres. About 106 hectares of the allocation, 44 per cent, lie within 300 metres of the A13, and about 154 hectares, 63 per cent, within 500 metres. There is no fixed national buffer distance. The professional guidance for new homes (ProPG, 2017) works from these levels and treats a site at about 70 dB by day, the median level within 50 metres of the A13 here, as high risk, where refusal on noise grounds is a real prospect without good acoustic design [134].
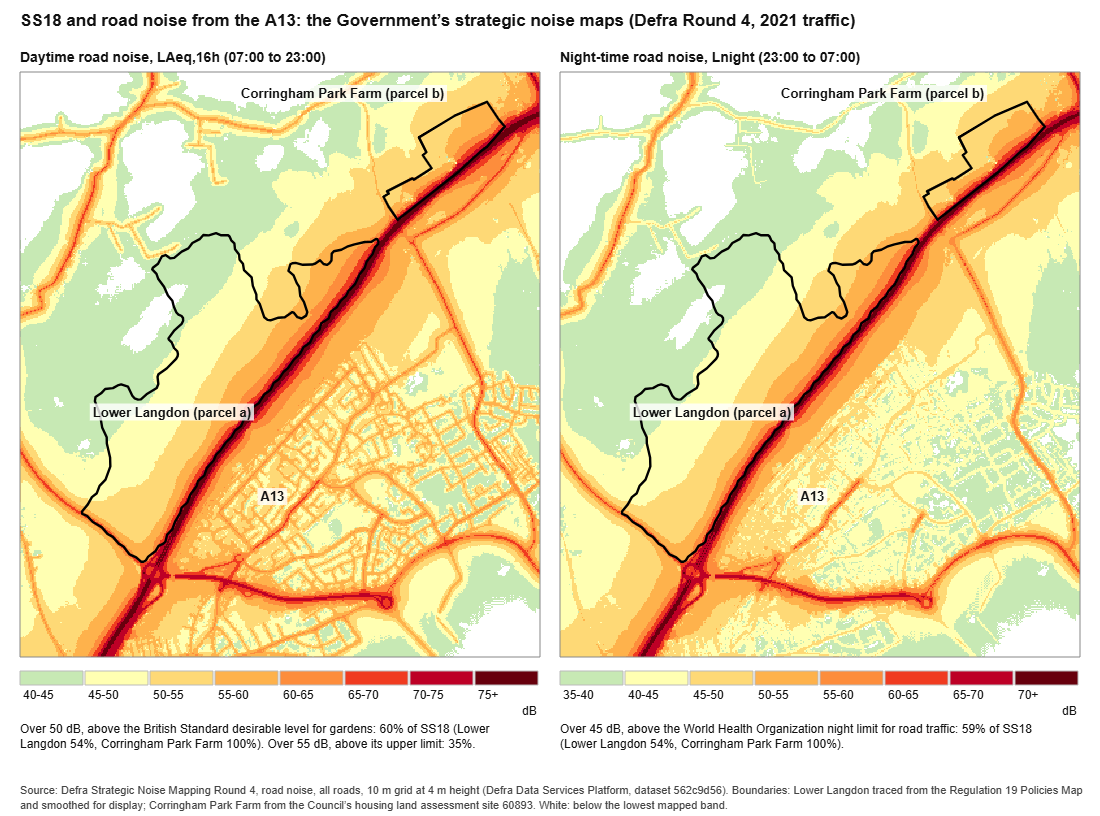
What it shows. On the Government's own model, nearly 60 per cent of the allocation is already above the WHO's recommended limits for road traffic noise by day and by night, and above the British Standard's desirable level for gardens. More than a third is above its upper guideline. All of Corringham Park Farm, which the policy says will be built first, is above the WHO day and night limits, and more than two thirds of it is above the upper guideline for gardens. These are levels before the new town adds its own traffic.
What a barrier could and could not do. A check of the existing ground (Environment Agency LiDAR) shows that the land rises from about 7 to 18 metres beside the A13 to about 50 metres at the northern edge of Lower Langdon, up to about 33 metres above the nearest point of the road, and to about 42 metres at Corringham Park Farm. Because that rise is spread over up to 1.2 kilometres, the ground is nowhere steeper than about 1 in 10 as seen from the road, so a barrier at the edge of the road would still sit between the traffic and almost all of the site [134]. This representation therefore does not argue that a barrier could not work. It argues that none is proposed, costed, designed or given land, that one long enough to protect both parcels would run for about 4 kilometres along the A13, in the Green Belt and in the setting of the SSSI and of Horndon on the Hill's listed buildings, none of which has been assessed, and that the Council's own 2023 finding, that the A13 limits the developable area, was not carried into the capacity on which the 5,000 homes rest.
What a bund and fence would cost, and what it would take. The established answer beside a busy road is an earth bund with an acoustic fence on its crest: for example, beside the M40 at Banbury a housebuilder built an engineered bund about 1,300 metres long and 2 to 9 metres high, with a close-boarded acoustic fence, approved by Highways England after noise modelling found much of that site above the planning thresholds [134]. For SS18 the A13-facing edges are about 4.1 kilometres long (about 3.0 kilometres at Lower Langdon and 1.1 at Corringham Park Farm). A 6-metre bund with a steep reinforced road face, a 2-metre crest and a 1 in 3 back slope occupies a strip about 22 metres wide and holds about 72 cubic metres of earth per metre: about 296,000 cubic metres in all. At £300 to £500 a metre for an acoustic fence installed (a National Highways contract for more than 1,000 metres of acoustic barrier on the A47 was let at up to £500,000) and an assumed £5 to £15 a cubic metre for site-won earth moved and compacted (an assumption, not a sourced rate), the bund and fence would cost about £2.7 million to £6.5 million [134]. The cost is not the main point. The strip takes 6.0 hectares of the land the capacity study counts as developable (3.5 at Lower Langdon and 2.5 at Corringham Park Farm, after the setbacks the Council already applies), which on the Council's own capacity figures removes a further 127 homes, from 2,861 to 2,734 (Appendix I, Table I2). With SANG to Natural England's standard as well, the figure falls to 2,126. Carried into the Council's own appraisals with the bund's cost added, the land is left £51 million to £56 million short at the plan's 35 per cent affordable housing, and no affordable housing is viable even at the stated ten-times land price (Appendix J, Table J1). Added at each step rather than the last, the bund lowers every result: the Council's own capacity falls from 17 per cent affordable housing to 14, the drainage step from 5 to 2, and from the Fell-me-down Shaw step onward none is viable (Figure 6). None of this is in the policy, the IDP, the viability study or the capacity study.
What the Council required on two recent estates beside the A13. Two estates near the A13 at Stanford-le-Hope were recently built on land released from the Green Belt by the 2011 Core Strategy: 127 homes off Stanford Road (17/00403/FUL, approved by Planning Committee on 18 October 2018) and 153 homes off The Manorway, west of Victoria Road (outline 14/01321/OUT, 2015; reserved matters 18/01660/REM, 2020) [135]. They could be cited as proof that homes can be built near the A13 without a barrier. The planning files show something different.
• Each had a site noise survey and assessment before approval, reviewed by the Council's Environmental Health officer, and a planning condition requiring the noise measures to be installed before occupation (condition 24 and condition 39).
• On the Stanford Road estate the developer built no barrier of its own. It relied on rows of three-storey terraces as a screen, enhanced glazing and acoustic vents, with windows kept closed in the most exposed homes. Its own assessment records that the A13 is already screened there by the ground and an existing A13 acoustic fence. Gardens were predicted at 57 to 61 dB, and one communal area at 73 dB. The Environmental Health officer wrote that "The external noise levels affecting gardens and outdoor living areas all exceed the WHO upper criteria of 55dB LAeq,16hr". The committee report called this "negative harm" to be weighed "to a site which is identified for housing development in the current Development Plan".
• On the Manorway estate the assessments relied on existing and planned barriers beside The Manorway. The 2018 assessment recommended a 4-metre acoustic fence along the railway, which would cut only 2 to 3 dB in gardens because the A13 and The Manorway dominate. It found gardens backing onto The Manorway would stay above the desirable level. The approved boundary plan shows an acoustic fence "to specialist design".
Table Q2. The two Stanford-le-Hope estates and the A13 edge of SS18 on the Government's noise map.
Government noise map, Round 4 |
Stanford Road estate |
Manorway estate |
SS18, within 50 m of the A13 |
SS18, 50 to 100 m |
SS18, 100 to 150 m |
|---|---|---|---|---|---|
Daytime median, LAeq,16h |
57.3 dB |
56.6 dB |
70.6 dB |
63.8 dB |
59.3 dB |
Night median, Lnight |
52.5 dB |
51.5 dB |
64.4 dB |
57.7 dB |
53.5 dB |
Share at or above 55 dB by day |
93% |
84% |
100% |
99% |
95% |
Three points follow. First, the Council required a site noise assessment and secured mitigation by condition on both estates. SS18 has no assessment and no requirement. Second, the Council's officers accepted noisy gardens on both estates because the land was already allocated. That reasoning cannot justify the allocation itself, which is the stage at which this harm must be weighed for SS18. Third, without a barrier the result on both estates was closed windows, acoustic ventilation and gardens above the guideline, for 127 and 153 homes. SS18 would repeat that for thousands of homes on land that is louder at its A13 edge, by about 13 dB by day, and has no existing screen.
The alternative, distance. Without a bund, homes would have to stand about 300 metres back from the A13 to meet the upper guideline for gardens, which would take about 106 hectares, 44 per cent of the allocation, and about 500 metres to meet the desirable level and the WHO night limit, about 154 hectares, 63 per cent. That is not modelled in the step-down because, at that scale, the allocation would no longer resemble the scheme the Council has assessed.
Limits. Strategic noise maps are modelled annual averages made for strategic planning, not a site noise assessment. That assessment is what the Council has not done. Levels at garden height (1.5 metres) can be a little lower than at 4 metres away from the road. The boundaries are accurate to a few tens of metres. New buildings would screen some land and reflect noise onto other land. The two estates are measured over their OpenStreetMap residential areas (3.3 and 5.5 hectares), which may not match the permission boundaries exactly, and whether the Round 4 model includes their new buildings and fences has not been checked. Whether the Manorway estate's acoustic fence was built to 4 metres has not been checked on the ground.
Test engaged. Justified: an allocation for 5,000 homes with no noise evidence, on land the Government's own maps put largely above health-based limits, when the Council required site noise evidence for 127 and 153 homes nearby. Effective: the mitigation the capacity depends on is neither identified nor provided for. Consistent with national policy: the NPPF expects plans to avoid noise giving rise to significant adverse impacts on health and quality of life (paragraph 198(a)).